
Piotrotski F-score
The Piotroski F-score is a financial score developed by Joseph Piotroski to identify companies that look attractive from a valuation perspective, but that investors should actually avoid. In particular, the Piotrotski F-score helps investors to avoid so-called ‘value traps’. The method was first introduced in an article titled “Value investing: The use of historical financial statement Information to separate winners from losers”. Companies that score low should be avoided. Companies that score high are attractive.
On this page, we provide the financial ratios that the Piotroski F-score looks at and implement a Piotroski F-score example in Excel. The example illustrates how we can easily create a Piotroski F-score screener.
Piotriski F-score definition
The F-score ranges between 0 and 9. Thus, a score of 9 means that the company is very attractive from a valuation perspective. That is because all of the financial ratios suggest that the balance sheet of the company is healthy. If a company has a score of zero, however, it means that the company is likely a value trap and is cheap for a reason.
The nine ratios we need to calculate to come up with the F-score are:
- Return on assets
- Cash Flow from Operations
- Increase in Return on Assets
- Cash flow versus return on assets
- long-term debt to assets
- change in liquidity
- stock issuance
- Gross Margin
- Asset turnover
Having calculated the mine ratios, we can calculate the F-score, based on the following set of rules. For each ratio, the rule if the following:
- Return on assets > 0
- Cash Flow from Operations > 0
- Increase in Return on Assets > 0
- Cash flow > return on assets
- long-term debt to assets < 0
- change in liquidity > 0
- stock issuance < 0
- Gross Margin > 0
- Asset turnover > 0
Thus, if the criterion is met, then the indicator value for that ratio is 1. If a company meets all 9 criteria, its score is 9. If, however, the company does not meet any of these criteria, the score is 0. It is clear that we can implement this kind of analysis easily. A simple Excel spreadsheet to create a Piotroski stock screener.
Next, let’s have a look at an example that explains how exactly we can calculate a Piotroski score for a stock.
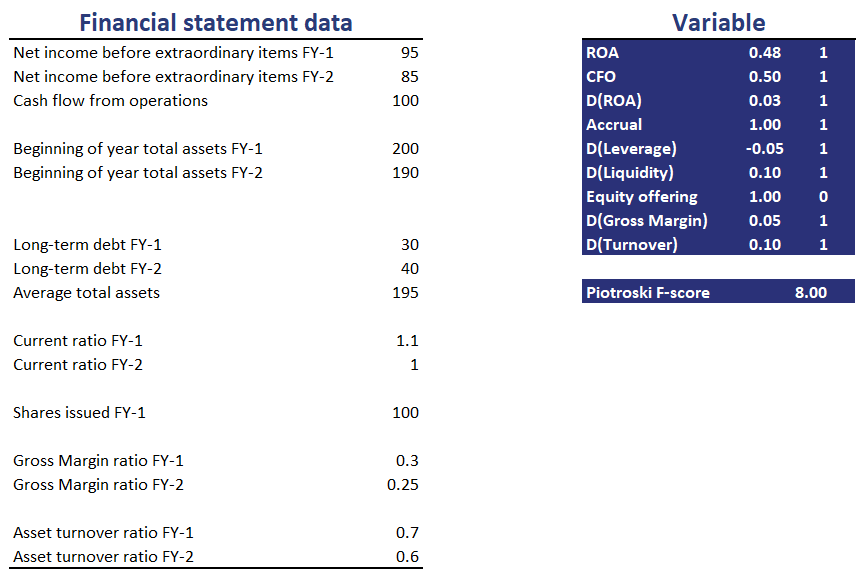
Piotroski F-score calculator
The following table illustrates the calculations for each of the 9 variables using the necessary financial statement data. Using some sample data, we illustrate all the necessary calculations. The Piotroski F-score spreadsheet can be downloaded at the bottom of the page.
Summary
We illustrate how to calculate the Piotroski F-score. This is a very popular method used by value investors to avoid value traps. By looking at the financial statement of a company, we can check whether the balance sheet is healthy or not.
F-score stock calculator
Download the Piotroski F-score spreadsheet: Piotroski F-score template