
Liquidity profiling and time to cash
Liquidity profiling and time to cash tables are used to assess the amount of liquidity risk of a portfolio. In particular, these measures are used to determine how quickly a portfolio can sell the securities it is holding during difficult market environments. There are four main methods used, liquidity profiling and time to cash tables (which we discuss here), rebalancing and commitments, stress testing, and the use of derivatives.
On this page, we discuss how liquidity profiling works and how time to cash tables should be interpreted.
Liquidity profiling
The first step is to identify the inflows and outflows. Take as an example a university endowment. While it will probably own considerable amounts of illiquid assets, it needs to meet cash outflows that go to the university. At the same time, these illiquid assets can lead to additional capital outflows as hedge funds and private equity funds may request further capital to be invested. There will also be cash inflows, in the form of donations and investment income earned from the portfolio.
Once cash outflows and inflows are identified, the next step is to establish a timeline that involves constructing a liquidity classification schedule.
Time-to-cash table
The liquidity classification schedule or time-to-cash table typically has three distinct components:
- The amount of time needed to convert assets to cash
- liquidity classification level
- liquidity budget
The next figure is an illustration of what a time-to-cash table looks like:
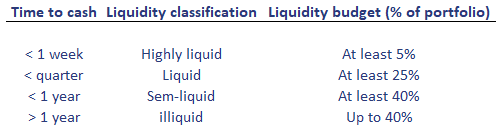
The first column is the time to cash indicates the amount of time needed to liquidate a holding. This can range from less than a day to multiple years. It depends on the investor’s cash outflows. The second column reports the liquidity classification. It is closely linked to the amount of time it takes to liquidate an investment without having a major impact on markets. This is the case when there is a minimal differential between the expected market price before and after the sell transaction.
Finally, we have the liquidity budget. This provides the minimum or maximum percentage allocations for the different time periods. This liquidity budget applies both in normal market conditions as well as stressed market conditions.
Summary
We discussed methods to manage liquidity risk. In particular, we discussed the use of liquidity profiling and time to cash tables.