
Jensen’s alpha
Measuring the performance of a portfolio just by looking at its return is not a good idea. First, the performance of the fund is not risk adjusted. Thus even though the portfolio had a higher return than another, this may just be attributed to more risk, or even more risk than justified by its performance. Secondly, the portfolio may even have realized a negative return. Negative portfolio returns do not necessarily indicate bad performance. This is because the market may have performed even worse. A good performance metric thus accommodates for the risk taken and optionally, measures the performance relative to a benchmark.
Jensen’s alpha formula
The Jensen’s alpha is another popular performance measure used to measure the retaliative performance of a portfolio. The Jensen’s alpha is the result of the following regression, where rp,t stands for the portfolio return over time, rm,t the market return, rf,t the risk free rate, β the systematic risk component and αpj the Jensen’s alpha.

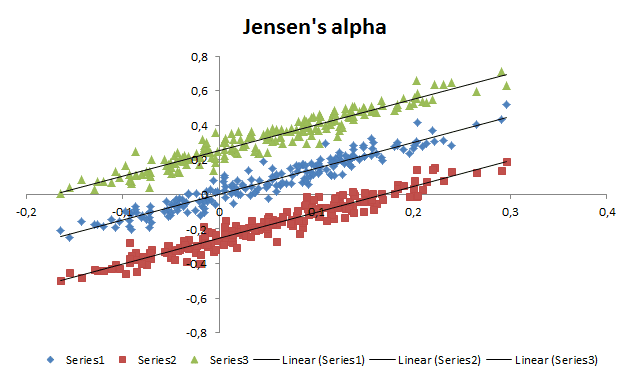
This regression indicates whether a certain portfolio, portfolio manager has outperformed or unperformed a certain benchmark taking into account systematic risk. Practically, a positive alpha thus indicates outperformance, a negative one underperformance. Moreover, the Jensen’s alpha also shows the estimated amount by which the benchmark has been outperformed. Therefore, this metric can additionally be used to assess a fund manager’s performance and attach some performance related compensation to it.
Summary
The Jensen’s alpha is a simple but widely used performance metric for analyzing portfolio performances. It indicates whether their is out or underperformance and to what extent. Moreover, the metric adjusts for risk and market performance.
Jensen’s alpha Excel Implementation
Need to have more insights? Download our free excel file: