
Drawdown
Drawdown is a risk measure used in asset management (mainly by hedge fund investors) to evaluate how long it typically takes an investment to recover from a temporary decline its net asset value. It is a measure that, especially in recent years, has become more popular in finance and risk management in particular. In the Excel file below we illustrate how we can perform a drawdown calculation for a randomly generated portfolio. But first we discuss the concept in detail.
Drawdown definition
It is the extent to which an investment is below the highest net asset value achieved by that investment. In particular, the peak-to-trough or peak-to-valley drawdown is simply the amount of loss incurred since the previous peak. It’s typically expressed as a percentage from the previous peak. As such, it is a measure of downside risk. The recovery period or ‘time under water‘ is the time that the investment needed to reach the level of the previous peak again. The shorter this recovery period, the better.
Drawdown formula
Having discussed the concept, we now discuss how to calculate it. Let’s denote the drawdown at time t as DDt. In that case, the asset’s current DDt equals

where pmax is the historical peak and pt is the current value of the investment or portfolio. In addition to the current DD, the average DD of an investment is perhaps more informative about the average level of DD the investor can expect from a portfolio or investment

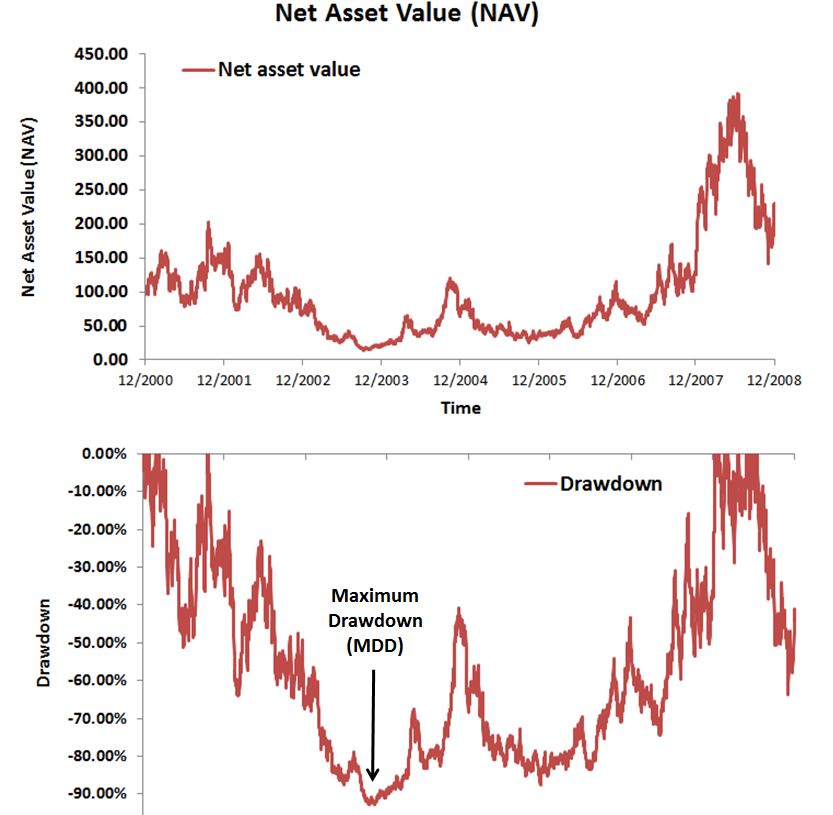
Maximum Drawdown definition
Maximum drawdown (MDD) is a measure that tries to summarize the historical DD experience of an investment or portfolio of securities in a single number. For risk management purposes, this statistic might be a better measure of downside risk than the average just discussed. The MDD calculation is fairly simple, as it refers to the largest DD experienced historically. As such the MDD formula equals

This value measures the largest percentage loss a hypothetical investor could have experienced on the investment. This is because this value captures the worst-case scenario of an investor who invested at the peak and held the portfolio or asset all the way down to the trough.
Conditional drawdown definition
Another related measure used in risk management is the so-called conditional drawdown. This is the average portfolio drawdown experienced in excess of a certain cut-off threshold α

Now that we have discussed all the different concepts, the Excel file at the bottom of the page provides a simple implementation of all the above metrics. It illustrates that it’s fairly easy to analyze a portfolio’s downside risk using a simple spreadsheet. We should, however, keep in mind that a drawdown analysis is always based on historical data. It doesn’t provide a lower floor for the percentage loss we can actually incur on an investment. In order for the analysis to be meaningful, we should a sufficiently long track record of the portfolio or asset.
Summary
We have discussed the concept of drawdown. This measure is mainly used in the hedge fund industry to analyze hedge funds’ downside risk and risk management practices. However, it is also a useful measure for investors more generally. It quantifies the percentage loss investors have faced and/or could potentially face in the future.
Drawdown analysis Excel
Want to implement the above measures? Download our Excel file: Drawdown.