
RSI indicator
The RSI indicator, also know as the relative strength index is an oscillator developed by Wilder. It build on the idea that securities can have momentum in their prices which can be identified by rapped build ups or declines in their respective prices. As a result, the RSI indicator is used to identify overbought and oversold securities. Thus, the RSI indicator tries to generate excess returns by taking advantage or price reversals in securities.
RSI formula
The RSI indicator is calculated as shown in the formula below. From this formula, it is clear that the RSI will always take a value between 0 and 100. When the RS is  (99) the RSI equals 0 (100). From this, the RSI obtains its oscillating before. Therefore the RSI is also called the RSI oscillator.

Calculation of the RS follows from the formula below. The RS (relative strength) is simply the ration of 2 exponentially weighted moving averages. The first EWMA is based on the past x upward closing days price differences. The second equals the past x downward closing price differences. In case of the RSI, the lag parameter α equals to the inverse of the x amount of lag periods. Often technical analysts use a 14-day lag period.


On days where the closing price is higher than yesterdays closing price, U equals the price difference and D equals 0. Whereas when the closing price is lower than yesterdays closing price, U equals 0 and D equals the price difference. On days without a price difference, both U and D are set to 0.

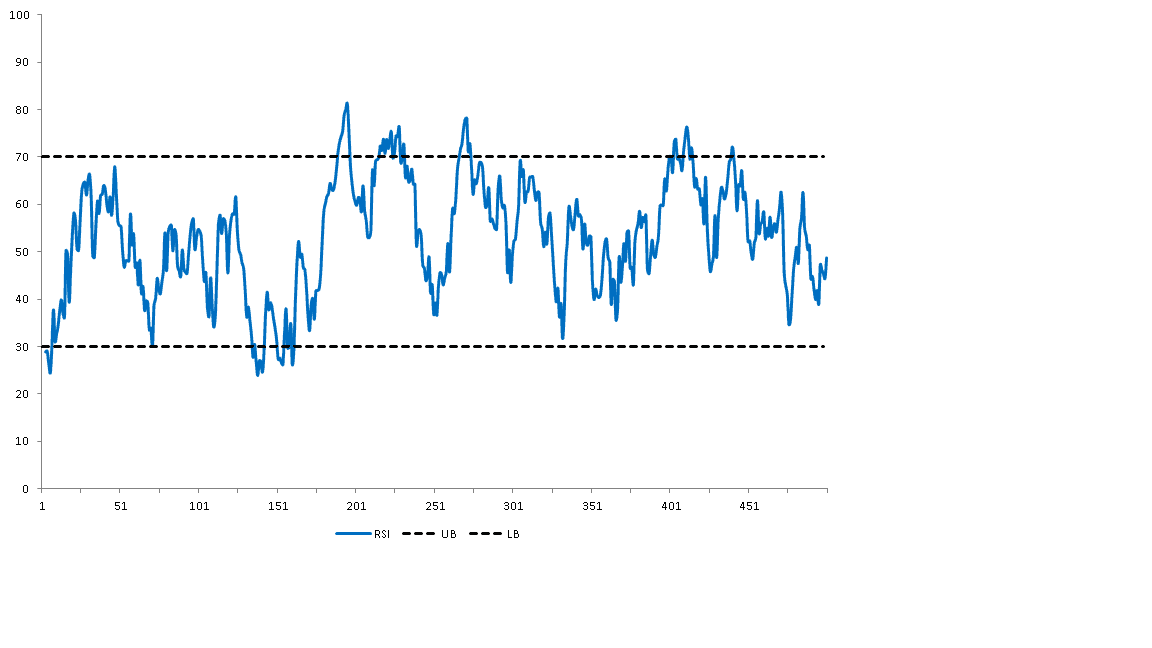
RSI trading strategy
Technical analysts implement a RSI trading strategy as follows. When the RSI has values above a certain threshold, often 70, it is said that the security is overbought. As such, the security is in the selling zone and is expected to revered downwards. Whenever the RSI has a value below a certain threshold, e.g. 30, it is oversold. Therefore, it is argued that the security will revered upwards and is therefore in the buying zone. Whenever a double top or a double bottom is formed in the selling or buying zone, the RSI signal has increased strength according to technical analysts. As a result, a clear sell or buy signal is generated.
Summary
The RSI indicator is a technical indicator that tries to take advantage from price reversals in securities. The indicator is an oscillator that takes values within the range of 0 to 100.
RSI indicator
Want to have an implementation in Excel? Download the Excel file: rsi indicator