
CAPE ratio
The cyclically adjusted price-to-earnings ratio (CAPE) or Shiller P/E is a financial metric that can be used to evaluate companies and market indices. The CAPE ratio was introduced by Robert Shiller. The CAPE ratio allows investors to assess current stock market valuations by using a smoothed version of companies’ P/E ratio.
The CAPE is calculated by dividing the current price of a company or market index by its average earnings over the past ten years, adjusted for inflation. Averaging earnings over the past 10 years is intended to account for fluctuations in the business cycle and provide a more stable measure of valuation over time.
Motivation
One-year of company earnings are often too volatile to provide a good sense of a firm’s true earning power. This is because a lot of different factors impact a company’s earnings in any given year.
One obvious factor is the business cycle. Suppose we have a company whose sales are very sensitive to the business cycle, e.g. a company producing cars. If the economy is performing really well, a lot of people buy a new car and the company’s sales go up. Consequently, the company’s P/E ratio will drop. This would suggest that the company has become cheaper. However, the following year we experience a recession and car sales of the company drop a lot. In that case, the P/E ratio will increase and the company will appear expensive.
Clearly, a better measure of the company’s earnings power is an average of the good and the bad years. This is what Shiller’s P/E ratio attempts to do. Instead of using the last available earnings, the CAPE ratio is based on the companies’ earnings over the past 10 years. That way, we smooth out the effect of the business cycle and other one-off events.
CAPE Calculation
The CAPE ratio can be calculated as follows. First, we collect the earnings (per share) over the past 10 years for an equity index such as the S&P 500. We adjust each of these earnings for inflation and then calculate the average. Finally, we divide the result with the current index value of the S&P 500 to obtain the CAPE ratio.
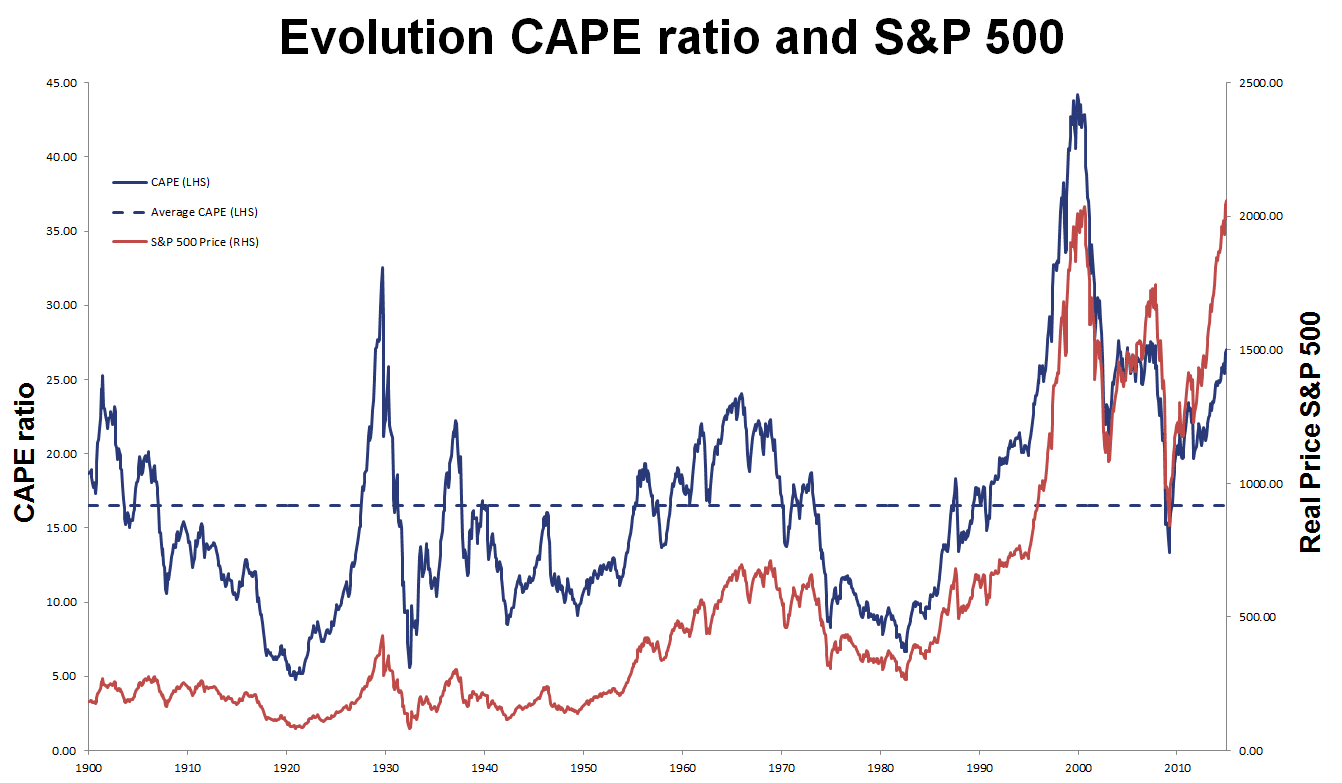
The P/E 10 ratio is highly time-varying, since stock prices can fluctuate considerably over time. In the figure, we plot the Shiller P/E for the S&P 500 as well as the S&P 500 itself. The date used for this figure can be found on Robert Shiller’s homepage.
CAPE ratio interpretation
The best way to interpret the CAPE ratio, is to compare it to it’s long-term average value (the dotted line). For example, when the ratio is above it’s historical average (the market is relatively expensive or ‘overvalued’), future stock returns tend to be lower. The opposite is true when the ratio is below its long-term average (the market is relatively cheap or ‘undervalued’).
The CAPE ratio is less useful if you want to time market tops or bottoms, and thus it shouldn’t be used for market timing. Another criticism is that the CAPE ratio is overly bearish and does not take into consideration changes in accounting standard and changes in interest rates. If we look at the figure, we observe that the CAPE ratio was just below it’s historical average when markets bottomed in March 2009. This suggest that markets were only slightly overvalued back then. Which of course is not very true.
Summary
The CAPE ratio tries to smooth out year-to-year variations that might bias the PE ratio. That way, investors can get a better idea of the actual value of a share.