
Sterling Ratio
The Sterling ratio is a measure of risk-adjusted performance that is commonly used to assess the performance of hedge funds. The measure was first proposed by Deane Sterling Jones in 1981, an asset management company. Unlike the Sharpe ratio, the Sterling measure of risk-adjusted performance does not use standard deviation to measure risk. Instead, the Sterling uses the average drawdown to measure risk.
We discuss the Sterling ratio definition, the formula and compare the ratio to the Sharpe ratio. Finally, we provide a spreadsheet that shows you how to implement the Sterling ratio in Excel.
Sterling ratio definition
There are several definitions of the ratio. What all these variations have in common, however, is it that they look at the return over average of maximum drawdowns. In particular, the worst drawdown in each year is calculated and then the average is calculated. The compounded return is then divided by the average annual drawdown. Next let’s turn to the Sterling formula.
Sterling ratio formula
We define the Sterling metric as follows:

In this case, drawdowns are expressed as a negative number. The resulting SR is then multiplied by -1 to obtain a positive ratio. The reason for the 10% in the denominator is that the ratio was proposed at a time when the T-bill rate was 10%. Nowadays, of course, this 10% no longer makes sense. That is why a lot of people use a slightly different definition, which we discuss below.
Sharpe ratio versus Sterling ratio
Let’s look at an alternative definition of the Sterling measure, which makes it look more like a Sharpe ratio

The Sharpe ratio and Sterling are both measures of risk-adjusted performance. Still, it is clear from the formula where the difference lies. The Sterling metrics measures risk using the average drawdown, instead of standard deviation.
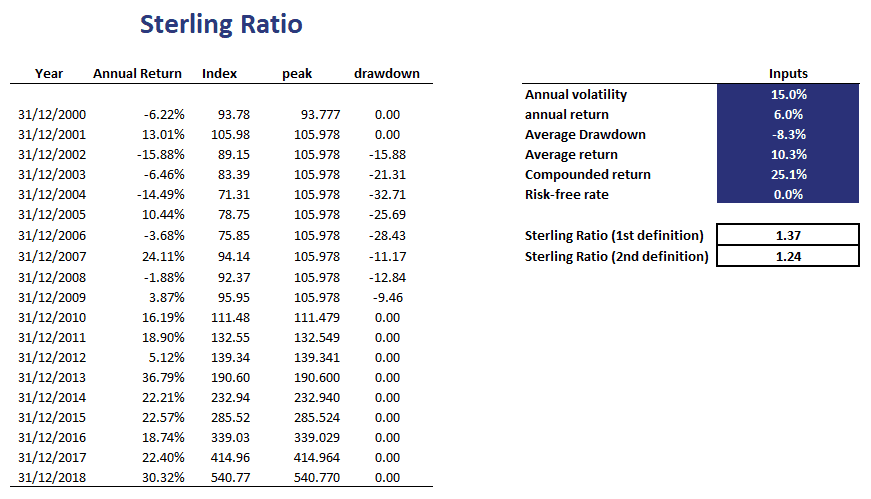
Example
Finally, we implement an example using an Excel spreadsheet. This illustrates that we can easily implement the Sterling metric once we have the time-series of security returns. Then, we first calculate drawdowns. Once we have the average drawdown, we can proceed be dividing excess returns by the average drawdown as in the formulas above.
Summary
We discussed the Sterling measure, a measure of risk-adjusted performance that uses drawdowns to measure risk. It is most commonly used to assess absolute return strategies such the strategies followed by hedge funds.
Sterling ratio calculator
Want to have an implementation in Excel? Download the Excel file: Sterling Ratio template