
PEG Ratio
The P/E-to-growth (PEG) ratio captures the relationship between growth and the P/E ratio. The PEG ratio can be interpreted as the P/E per unit of expected growth. Below we discuss the PEG ratio formula, an example in Excel as well as the drawbacks of the PEG ratio. The spreadsheet used to calculate the ratio is available for download at the bottom of the page.
PEG ratio formula
The price-earnings-to-growth ratio formula very straightforward. In particular, we just divide the company’s P/E ratio by the growth rate g. This standardizes the P/E ratio for stocks with different growth rates

where g is the growth rate and P/E is the P/E ratio of the company. How to interpret the PEG ratio? The rule is the following. The lower the ratio, the more attractive the company. Thus, analysts prefer stocks with lower price-earnings-to-growth ratios compared to similar stocks with higher price-earnings-to-growth ratios. An important assumption here, is that when comparing PEG between companies, the companies should be similar in terms of risk.
PEG ratio drawbacks
The price-earnings-to-growth ratio has a number of drawbacks that make it difficult to use in practice. In particular
- The relationship between the price-earnings ratio and g is not necessarily linear
- The price-earnings-to-growth ratio does not account for the riskiness of the company
- The ratio does not reflect the duration of the high-growth period for a multistage model.
The last drawback means that, if the analyst only considers the short-term high growth rate, then the PEG multiple will be artificially low. In that case, the analyst will incorrectly conclude that the company is attractive based on the ratio obtained.
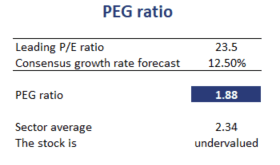
PEG ratio example
Next, let’s turn to an example. The table below calculates the ratio of a company. In particular, we compare the obtained price-earnings-to-growth ratio to the industry average. if the PEG of the company is above the industry-average, the company is considered overvalued. Similarly, if the PEG is below the industry average, it is undervalued.
Summary
We calculated the price-earnings-to-growth ratio, a measure used by analysts to adjust the P/E ratio for the growth ratio of the company. Despite the drawback that it does not consider risk, the PEG is often reported by analysts.
PEG calculator
Want to have an implementation in Excel? Download the Excel file: PEG