
Capital Allocation Line (CAL)
The Capital Allocation Line (CAL), sometimes also referred to as the Capital Market Line (CML), is a graphical representation of the trade-off between expected return and risk of two investments. The capital allocation line can help investors to decide how much they should invest in the risky asset (an efficient stock portfolio) and the risk-free asset (e.g. a government bond).
The CAL can be created by combining a set of portfolios with various proportions of the risky asset and the risk-free asset.
The approach is fairly simple and can easily be implemented in Excel. At the bottom of this page, there’s an Excel example that constructs the Capital Market Line along with the efficient frontier. But first we explain the theory behind the CAL.
Capital Allocation Line Example
Let’s consider a very simple situation where we have two assets we can invest in. We can choose to invest in a risky portfolio (of shares) and a riskfree asset (such as a government bond). Now suppose both assets have the following characteristics:
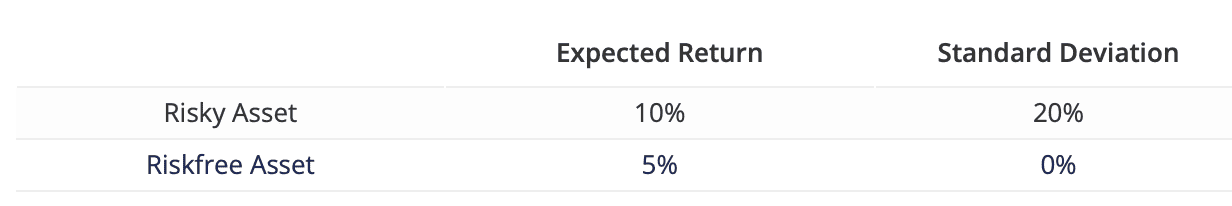
Since the riskfree asset is ‘riskless’, its standard deviation should be zero. Our portfolio of stocks is risky, but it also yields a higher expected return to compensate investors for taking risk.
Constructing portfolios
The basic question investors want to answer is how much to invest in both assets. To answer this question, lets first determine what the portfolio looks like if we combine both assets into a portfolio. Suppose the investor invests a fraction wr in the risky asset, and the rest (1-wr) in the riskless asset. In that case, the expected return of the portfolio (rp) can be determined using the following formula:

The riskiness of the portfolio rp can be calculated as follows:

The formula for the riskiness of the portfolio is really simple because the standard deviation of the riskfree asset is zero.
Next, we make a figure of all the different combinations of both assets. The resulting line is called the capital allocation line (CAL). It shows all the possible asset allocations available to the investor. Alternatively, each point on the CAL represents a portfolio with a different level of risk and return.
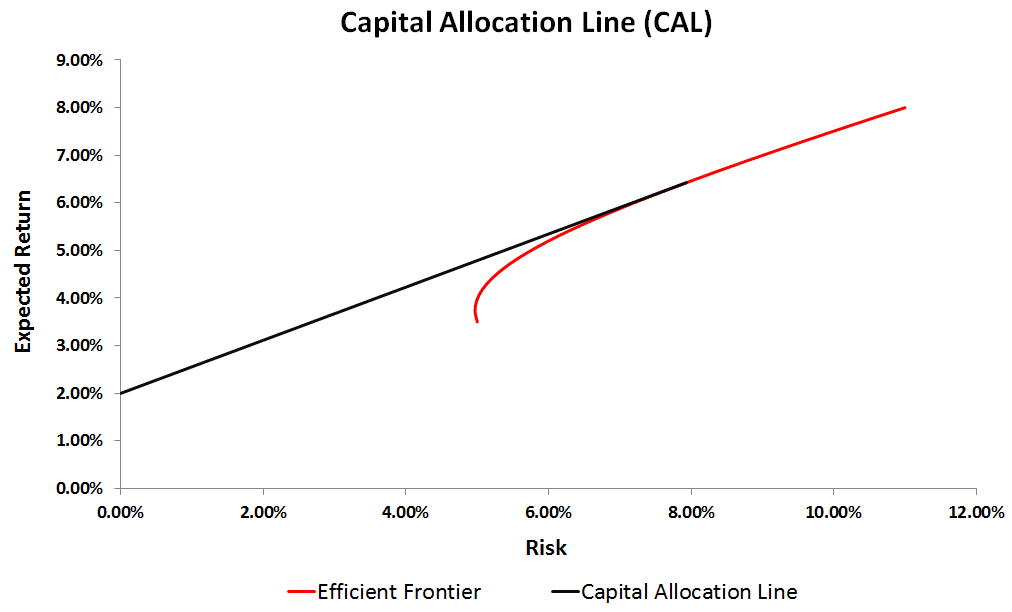
If we invest everything in the riskfree asset, our portfolio is riskless and we earn the return on the riskfree asset (2% in this case). As we move to the right, and invest more money in the risky asset, both the return and the riskiness of the portfolio go up.
Finally, if we invest everything in the portfolio of stocks, we earn the expected return of the risky asset. In that case, the riskiness of the portfolio also equals the riskiness of the risky asset. This is the point where the capital allocation line is tangent to the efficient frontier and we don’t hold the riskfree asset.
The tangency portfolio is the portfolio on the efficient frontier that has the highest Sharpe ratio. The tangency portfolio is the portfolio where the CAL touches the efficient frontier. It represents the optimal trade-off between risk and return for an investor. In fact, it is the portfolio that should be selected by an investor who wants to maximize risk-adjusted return.
Slope of the CAL
The slope of the capital allocation line equals:

This formula implies that the slope measures the trade-off between return and risk. The steeper the capital allocation line, the higher the expected return investors receive in exchange for taking risk. This risk/return trade-off is referred to as the Sharpe ratio. Thus, the higher the Sharpe ratio of the risky portfolio, the more attractive the set of portfolios the investor can choose from. This means that we always prefer a steeper capital allocation line to a flatter one.
Composition Risky Asset
Next, we need to determine the composition of the risky portfolio. From what we’ve learned above, we know it should have a Sharpe ratio that is as high as possible. That’s where Markowitz’s portfolio selection comes in.
Summary
By combining a riskfree and a risky asset, investors can construct portfolios that exhibit different levels of risk. That way, we can construct portfolios that meet investors’ needs. The Capital Market Line (CML) helps investors in allocating money between the risky- and the riskfree asset. The model can easily be implemented using an Excel spreadsheet.
Capital Market Line (CML)
Want to apply the approach yourself? Download the Excel file: CapitalAllocationLine.