
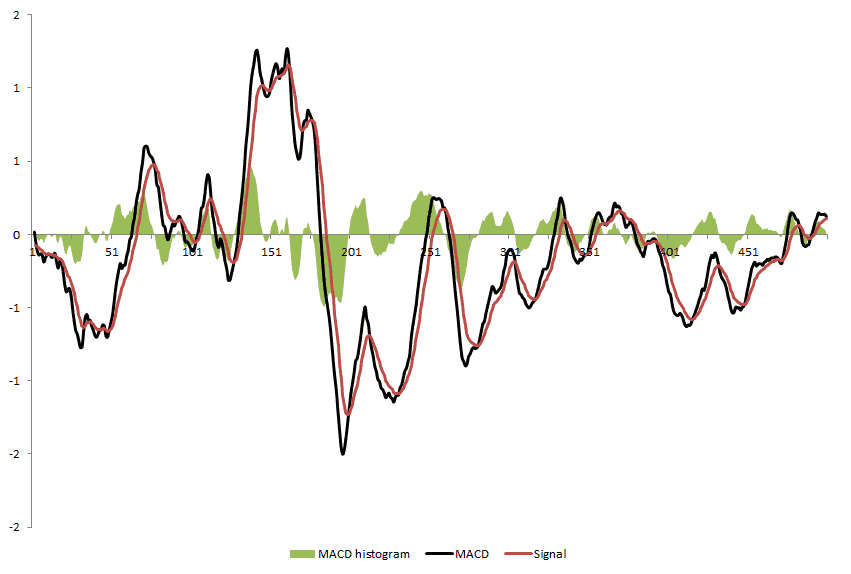
MACD
The MACD, also called to moving average convergence divergence indicator, is a widely used and popular technical indicator. It is used to identify trends in asset prices their time series. For its calculation, it is closely uses the exponentially weighted moving average formula. Its name points towards the convergence or divergence of 2 moving averages. Technical analysts argue that this convergence (divergence) indicates declining (increasing) momentum.
MACD formula
First, the α needs to be determined in order to go forward in calculating various equally weighted moving averages. This is done using the following formula wherein we impose a certain amount of look back days, x.

This α is used to calculate the first EWMA. Thereafter, a new α is calculated in order to determine the second EWMA which has a longer lag. The MACD indicator is just the difference between these 2. Investors can impose any kind of lag to calculate it. Often imposed lags are 12 for the short EWMA and 26 for the longer one.

The signal line is simply an exponentially weighted moving average of the obtained indicator. Also here, any value can be used. A lag with value 9 is frequently adopted.

MACD histogram
The histogram, which is often plotted in various charts is obtained by subtracting the signal line from the MACD indicator.

Summary
The moving average convergence divergence, is a popular technical indicator used to identify trends. Its calculation follows from the exponentially weighted moving average. A convergence or divergence of the underlying EWMA measure the underlying momentum of the asset.
MACD
Want to have an in Excel? Download the Excel file: macd