
Average True Range (ATR)
The Average True Range or ATR is a measure of volatility that is often used by traders that use information on past prices for trading. The ATR was developed by Welles Wilder. He suggested the measure of technical analysis volatility originally for commodities. The ATR, however, is used nowadays for all futures contracts.
Average True Range Formula
To be able to implement the Average True Range, we need the daily high, daily low, and daily closing price of a security. The daily range of the security is simply the difference between the daily high and daily low:

The true range extends the daily range to yesterday’s closing price if the closing price is outside today’s range.
![$$= max[(p_{high}-p_{low}),abs(p_{high}-p_{close,t-1}),abs(p_{low}-p_{close,t-1})]$$](https://breakingdownfinance.com/wp-content/ql-cache/quicklatex.com-6bcdaa56f078230908b4043eb0a24ad2_l3.png "Rendered by QuickLaTeX.com")
In words, the above formula states that the True Range equals the largest difference of
- the last high minus the last low
- the absolute value of the difference of the last high minus the last close
- the absolute value of the difference of the last low minus the last close
Using the daily True Range, the Average True Range definition corresponds to a smoothed moving average of true range values. Welles Wilders suggests using a 14-day smoothed average. Most of the time, an exponential moving average is used to calculate the ATR. In that case:

The ATR for the first period equals the arithmetic mean:

Average True Range Interpretation
How do we interpret the ATR? And how to use average true range for short term trading? Basically, increases in the range indicate traders are prepapered to bid up the or sell a security. This means that higher values show increased enthusiasm or commitment. Similarly, decreasing ranges indicate that investors are losing interest. One of the advanteges of ATR is that it is a first moment measure of volatility. This is unlike the standard deviation, which is a so-called second moment measure, because standard deviation is an “averages of squared numbers”. As a consequence, the ATR is a more robust measure of volatility.
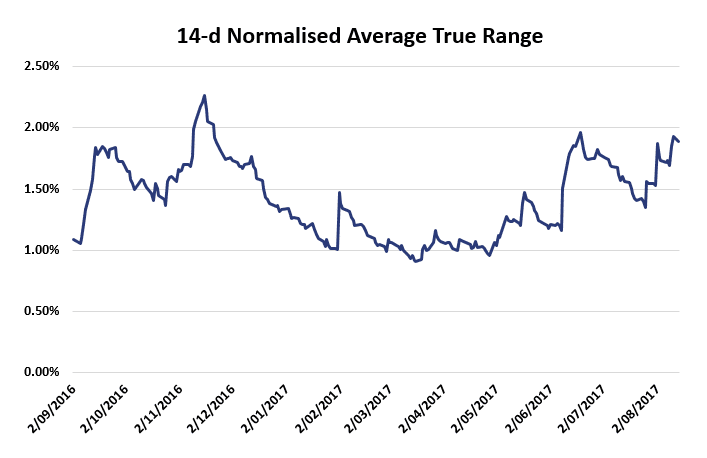
Finally, we can also define the normalized average true range which expresses the average true range as a percentage:

How to calculate Average True Range in Excel?
It is fairly easy to calculate the ATR in Excel. We implement the approach in Excel in this file: ATR template
Summary
We explained the ATR, which is commonly used to calculate price volatility. The ATR can easily be calculated in Excel and is a so-called first moment estimator of volatlity.