Yield Curve Risk
Yield curve risk refers to the risk to the value of a bond portfolio due to unexpected changes in the yield curve. There are different ways to calculate the risk of changes in the yield curve. The appropriateness of each method depends on type of change in the yield curve we expect or wish to analyze.
On this page, we discuss three methods to estimate the risk of changes in the yield curve. In particular, we briefly discuss effective duration, key rate duration, and the sensitivity based on level, steepness, and curvature. We briefly illustrate the different methods using a number of yield curve risk examples.
Effective duration
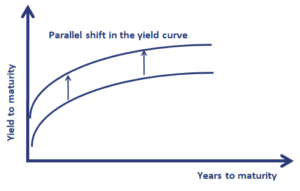
Yield curve risk is known by many as effective duration. While this just one of many ways of looking a yield risk, it is nevertheless a good starting point. Effective duration measures price sensitivity to small parallel shifts in the yield curve. It is, however, not a good measure of interest rate sensitivity in the case of non-parallel shifts in the yield curve. These non-parallel shifts in the yield curve are referred to as the shaping risk of the bond portfolio. Shaping risk measures the the changes in the bond portfolio that are due to changes in the shape of the yield curve.
Key rate duration
If we want to analyze non-parallel shifts in the yield curve, a more precise method to use is key rate duration. Key rate duration is the sensitivity of the value of a security to changes in a single par rate, holding all other spot rates constant. Thus, key rate duration holds all the other rates constant to isolate the price sensitivity to a particular rate change at a specific maturity.
Sensitivity to parallel, steepness and curvature
The third method we discuss here is a method that decomposes yield curve risk into three components. In particular, the method distinguishes between three types of yield curve movements:
- Changes in the level: a parallel increase or decrease in rates
- Changes in the steepness: short-term rates decrease and long-term rates increase
- Changes to the curvature: increasing curvature implies short-and long-term rates go up, while intermediate rates stay unchanged
Interestingly, almost any kind of yield curve change can easily be modelled using a combination of the above three factors. This approach is by far the most popular way to measure and model the risk of changes in the yield curve. Because it is so popular, let’s consider a simple yield curve risk example in which we use this third method to estimate the change in the bond portfolio’s value. The equation we need is the following
where DL, DS, and DC are the portfolio’s sensitivity to the level (L), steepness (S), and curvature (C).
Yield curve risk example
Let’s assume we have a certain portfolio and we have estimated the parameters of the model. In particular, we obtain the following sensitivities
Now, suppose we run a scenario in which the following changes to the yield curve occur. The level goes down by 0.004, the steepness increases by 0.001, and the curvature increases by 0.002. Using the formula, we obtain
or +0.5%. This means that we expect the portfolio’s value to go up by 0.5% if the yield curve changes the way it does under our hypothetical scenario.
Summary
We discussed three popular methods to measure the risk of changes in the yield curve. The third method that uses parallel, steepness, and curvature factors to model the risk of changes in the yield curve is by far the most popular.

