
Gross Profitability Premium
The Gross Profitability Premium (GPP) refers to the empirical observation that profitable companies outperform unprofitable companies. The effect was first described by Robert Novy-Marx in a paper called “The Other Side of Value: The Gross Profitability Premium” which was published in 2013 in the Journal of Financial Economics. The paper shows that controlling for profitability dramatically increases the performance of value strategies.
The gross profitability ratio is a so-called topline measure of profitability that can easily be calculated using the income statement. The measure is also sometimes referred to as the “quality factor” or the “profitability factor.” Investing using the GGP is a type of growth investing that works particularly well because it results in picking good growth companies. Good growth companies are fast growing companies that have high profit margins.
We discuss the gross profitability ratio formula as well as a numerical example in Excel that is available for download at the bottom of this page.
Gross profitability premium formula
The profitability ratio is calculated by taking a company’s gross profits (revenues minus cost of goods sold) and dividing it by its average total assets. The resulting ratio is a pure measure of the company’s ability to generate profits from its assets:

where COGS is the cost of goods sold. This metric can easily be calculated using a company’s income statement.
Advantages gross profitability ratio
The main advantage of the gross profitability measure is that it is the cleanest accounting measure of a company’s profitability. The same is not true for a company’s earnings. The further we go down the income statement, the more polluted profitability becomes.
For example, imagine a company spends a lot of money on research and development. The company does this to increase its production advantage or maintain a competitive advantage. These expenses result in lower current earnings but not profitability. Thus, unlike what popular media suggest, it is better to focus on top line profitability rather than earnings.
Gross profitability ratio example
The following table calculates the gross profitability premium for a company over time. Imagine we have a company that reports the following annual revenues, costs of goods sold and total assets. We can then easily calculate the gross profitability ratio over time.
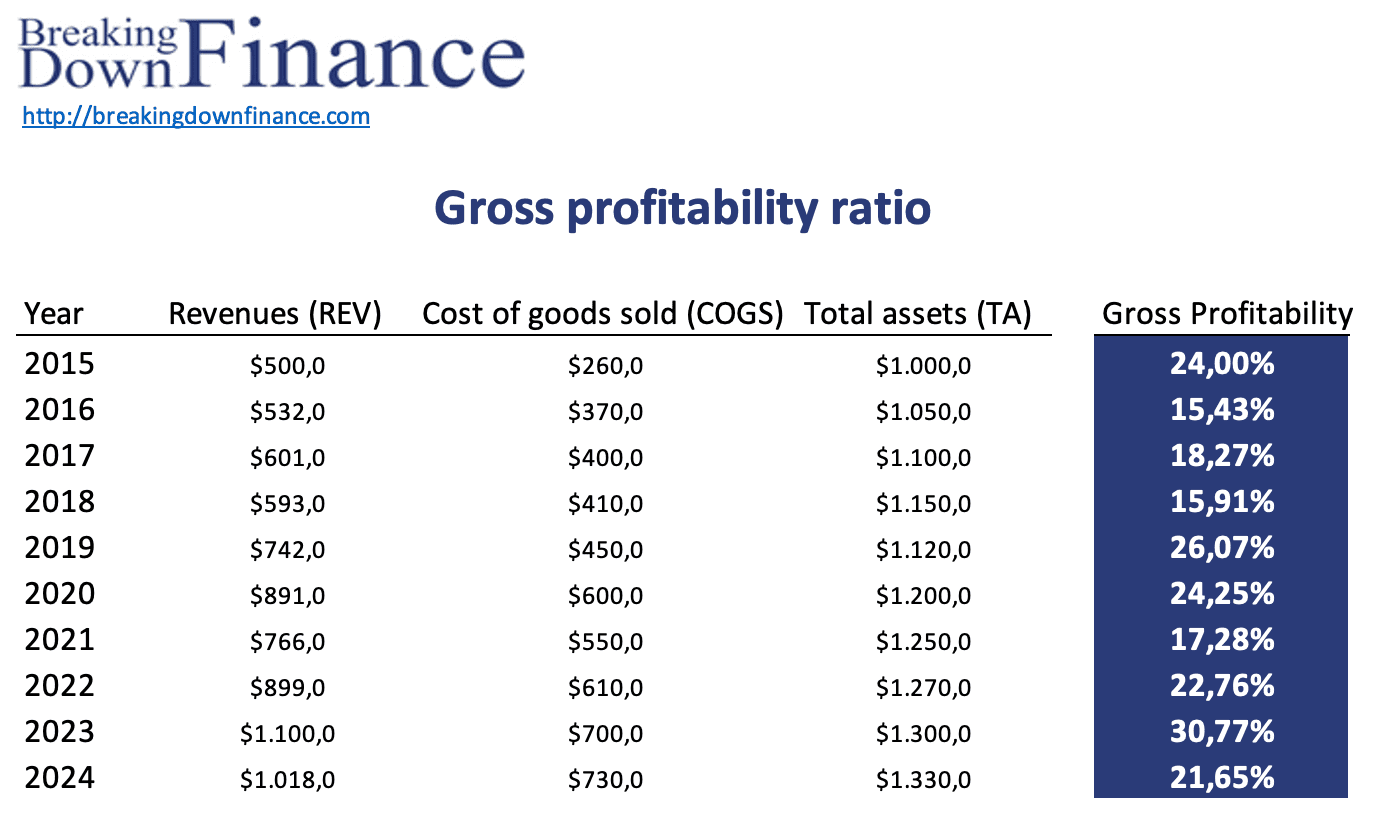
The spreadsheet used to create the above example can be downloaded at the bottom of the page.
Summary
The gross profitability premium consists of selecting productive assets, that is, companies that are very profitable. Gross profitability is able to generate an excess return that is similar in size to the value premium. Interestingly however, gross profitability is negatively correlated to value. This means that investors can combine both to achieve better returns.
Download the Excel spreadsheet
Want to have an implementation in Excel? Download the Excel file: Gross profitability ratio