
Annualize volatility
When investors estimate the volatility of an investment, they often do so using daily, weekly, or monthly returns. However, when we want analyze the risk-adjusted performance of an investment, we tend to use measures of volatiσlity that expressed in annual terms. For example, when we compare the Sharpe ratio between different investments, there are almost always expressed in annual terms. Therefore, we need to come up with a measure of annual volatility. Hence, we need to annualize volatility.
On this page, we explain how we can convert volatility estimated at the daily, weekly, or monthly level to an annualized measure of volatility. To do this, we will make use of the volatility square root of time rule, which allows us to calculate the annualized standard deviation
volatility square root of time rule
The volatility square root of time rule is a fairly simple concept. It argues that the relationship between time and volatility, as measured by the standard deviation, increases with the “square root of time”. In principle, this rule only applies to the normal case, i.e. when the returns are normally distributed and independent from one another. In that case, the relationship between time and the standard deviation equals

where T is the full time period for which want the standard deviation (e.g. 1 year), t is a single period (e.g. 1 month), σt is the standard deviation over a single time period. In that case σT is the T-period volatility. For example, if σt is a monthly measure of volatility, than multiplying the value with the square root of 12 will give you the annualized volatility.
While the standard deviation scales with the square root of time, this is not the case for the variance. To see this, let’s calculate the T-period variance. To do this, we take the power 2 of the left-hand side and the right-hand side.

or

Thus, the variance scales linearly with time! Now, let’s illustrate the above concepts using a simple numerical example of volatility scaling.
Annualizing volatility example
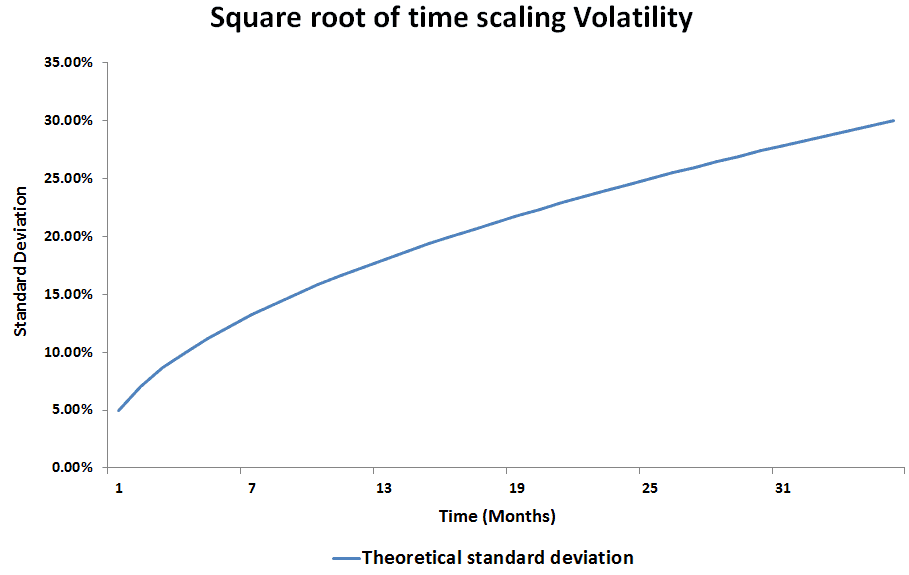
Suppose we have monthly returns for an asset. From these returns, we calculate the monthly standard deviation, and find it to be 5% per month. However, we need the annual standard deviation for our analysis. We can calculate the annual standard deviation as follows


The annualized volatility equals 17.32%. The following figure illustrates how the standard deviation evolves with time. We can clearly see that the relationship is not linear.
Summary
Annualizing volatility is an important consideration in a number of financial applications. For example, it matters when calculating value-at-risk or risk-adjusted performance measures (e.g. Sharpe ratio).
Return calculation
Want to annualize volatility in Excel: We’ve implemented the approach in Excel using Annualize volatility