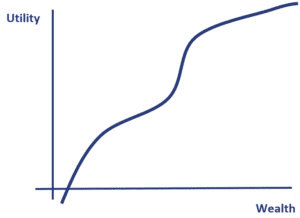
Friedman-Savage utility function
The Friedman-Savage utility function is a complex risk function proposed by Leonard Savage and Milton Friedman in a paper in 1948. The utility function’s curvature captures the fact that an individual’s utility function may depend on the wealth of the individual. As a consequence, the individual may be risk-averse or risk-seeking depending on how rich he or she is.
On this page, we discuss the Friedman-Savage utility function and how the individual behaves on different points of the utility curve.
Friedman-Savage utility function definition
The Friedman-Savage utility function is a so-called complex double-inflection utility function. Such a utility function captures the empirical observation that many people will simultaneously purchase lottery tickets (which have a high pay-off but a low probability) which is a kind of risk-seeking behavior, while also buying fire insurance (low-payoff and low probability) which is risk-averse behavior. How can individuals exhibit both types of behavior at the same time?
The solution is that individuals are reference dependent. This means that risk evaluation is influenced by the individual’s wealth and personal circumstances.
Example
Let’s consider an example in which an individual is faced with two gambles. The gambles are indicated on the figure.
- Gamble 1 has an equal chance of paying out A or B. At the expected pay-off (the average of the two), the expected utility is of the gamble is lower than the individual’s required utility. Thus, the price the individual is willing to pay is less than the expected pay-off (this is the certainty equivalent). Instead, the individual would be willing to pay a premium to avoid this expected outcome.
- Gamble 2 has an equal chance of paying out B or C. The expected pay-off (again the average of the two) is above the required utility. Thus, the price the individual is willing to pay is higher than the gamble’s expected pay-off. In this case, the individual would be willing to pay a premium to be exposed to the expected outcome.
The shape of the utility function drives this result. Point B is the inflection point, where the individual’s behavior moves from risk-averse to risk seeking. Between points A and B the individual is risk-averse. Between B and C he or she is risk-seeking. Beyond point C, the investors are exhibiting risk-averse behavior again.
Summary
We discussed the Friedman-Savage utility function which tries to explain why people can be risk-seeking and risk-averse at the same time for different gambles (e.g. buying lottery tickets and taking fire insurance).

