Sortino ratio
The Sortino ratio is a measure of risk-adjusted performance that tries to improve the more commonly used and more well-known Sharpe ratio. As discussed in the part on the Sharpe ratio, measuring the performance of a portfolio over time by just looking at the portfolio’s absolute performance is generally not a good idea. This is because different strategies can generate similar levels of return, but be exposed to widely different levels of risk. A good performance metric therefore also incorporates the risk component of a strategy. While both the Sharpe ratio and the Sortino ratio measure risk-adjusted performance of an investment, the Sortino ratio is considered an improvement over the Sharpe ratio, as it puts more emphasis on downside risk.
On this page, we first provide the Sortino ratio definition and then show how to calculate the Sortino ratio using an example. Finally, we conclude with a discussion of what can be considered a ‘good’ Sortino ratio.
Sortino ratio definition
The Sortino ratio
is a measure of risk-adjusted performance that only penalizes returns that fall below a user-specified required rate of return (called the ‘target return’).
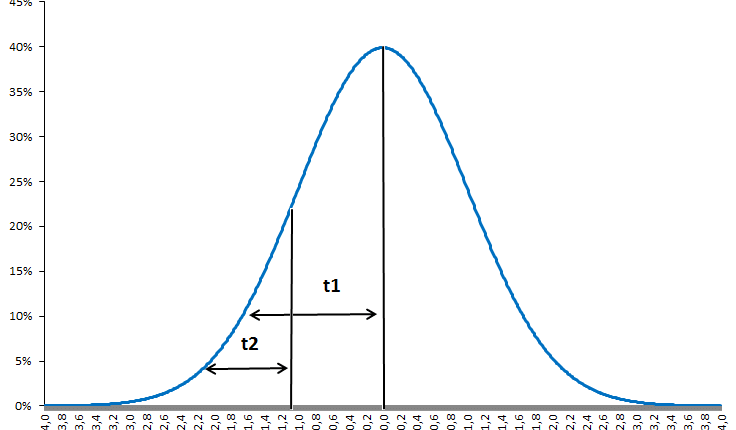
To see how the Sortino ratio differs from the Sharpe ratio, let’s first consider the Sharpe ratio. The latter is defined as the average excess return divided by the standard deviation of the portfolio. However, when using the standard deviation as a measure of risk, high positive returns will also lead to an increase in the standard deviation ( = ‘risk’) of the portfolio. However, high positive returns are a good thing. These returns should not be considered a ‘risk’. The Sortino ratio corrects for this by using the so-called ‘downside deviation‘, instead of the standard deviation. As such, the Sortino ratio considers downside risk.
Sortino ratio formula
As mentioned above, the Sortino ratio adjusts the average realized portfolio return rp, with a target return t (originally termed ‘minimum acceptable return‘ or MAR). The target rate of return is commonly set equal to 0, as negative rates of return is something we want to avoid. Alternatively, the risk-free rate or another target return can be used. The choice of the target or minimum acceptable return depends on the investment objective of the portfolio under consideration. The higher the portfolio return over the target rate of return, the higher the Sortino ratio will be
However, unlike the Sharpe ratio, the denominator of the Sortino ratio does not equal the standard deviation. Instead, the ratio adjusts performance for risk by only using the downside deviation, which is calculated as follows.
For the calculation of downside deviation, we only used the observed returns below the target return at each time stamp. Returns above the target rate of return are set equal to zero. Having set all returns above the target rate of return equal to zero, we then just apply the calculation for the sample standard deviation. The Excel spreadsheet below shows how to perform the Sortino ratio calculation.
Sortino ratio example
The Excel spreadsheet at the bottom of this page illustrates the Sortino ratio calculation outlined above. In particular, we calculate both the Sharpe ratio and the Sortino ratio for a set of monthly returns.
Interpretation
The interpretation of the Sortino ratio is a bit less straightforward than in the case of the Sharpe ratio, as the measure of risk (i.e. downside risk) has a less straightforward interpretation than the standard deviation. Moreover, since the parameter t can be arbitrarily chosen, interpretation should also take into account the particular threshold chosen.
As such, the Sortino ratio is best used as a measure to compare different portfolios in terms of downside risk. If the main aim of a portfolio is to avoid negative returns, it’s a more appropriate measure than the Sharpe ratio when choosing between different investments. In that case, the minimum acceptable return should be set to 0.
Summary
The Sortino ratio is a more somewhat more complex risk-adjusted measure of performance. First, the returns are measured against a target return which can deviate from simply the risk-free rate. The choice of this target return depends on the chosen strategy. Second, the ratio is adjusted for risk using a measure of downside risk.
Sortino ratio Excel Implementation
Want to perform a Sortino ratio calculation yourself? Download our Excel spreadsheet: Sortino Ratio

