
Zephyr Pain Index
The Zephyr pain index is a risk metric introduced by Thomas Becker and Aaron Moore of Zephyr Associates in 2006. While the measure is not frequently reported, it is sometimes used as a risk measure in more complex portfolio optimization or to evaluate investments on a risk-adjusted basis.
The pain index considers three aspects of risk in investments:
- First, it takes into account the magnitude of losses. This is called the drawdown depth
- Second, it take into account the length of a drawdown (time under water)
- Third, the pain index considers the frequency with which drawdowns occur (frequency)
This makes sense since the greater a loss, the longer it takes to recover or the more frequent losses, the more discomfort investors will experience when holding on to an investment. The higher the pain index, the harder the losses associated with a strategy. A pain index of zero indicates that the strategy never experiences losses, which is extremely unlikely.
We can summarize the concept behind the pain index using the following simple equation:
Pain Index = drawdown depth + drawdown Duration + drawdown Frequency.
On this page we discuss the pain index formula. We then apply the formula using an Excel spreadsheet. The sheet is available for download at the bottom of the page.
Zephyr pain index formula
Let’s have a look at the exact formula we should use to calculate the pain index of an investment using a historical time series of returns. The pain index formula equals:

where D(t) is the drawdown between time t1 and t2. In practice, we will use the discrete version of the above formula

Finally, we can also look at the relationship between realised return and risk using the Pain ratio:

Thus, we divide the investment’s excess return by the pain index. This approach is similar to other measures such as the Sharpe ratio or Sortino ratio.
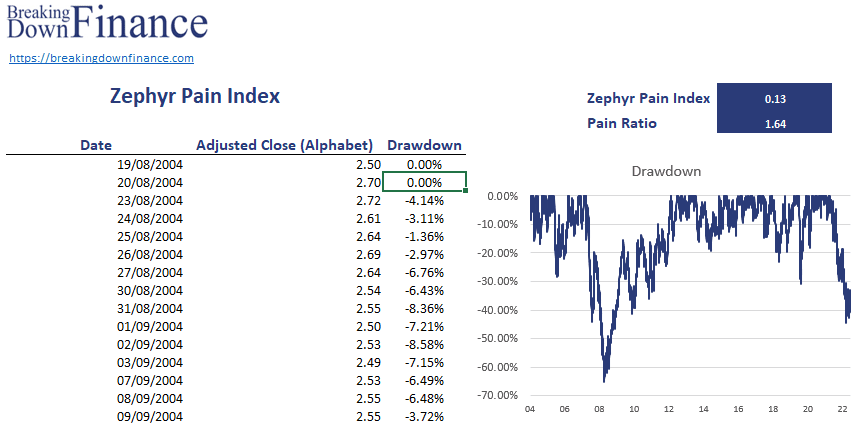
Zephyr pain index example
Let’s turn to an example using actual data. The following figure illustrates how to implement the approach in Excel. The Zephyr pain index spreadsheet is available for download at the bottom of the page.
Summary
We discussed the Zephyr pain index, which is equal to the average drawdown.
Download the Excel spreadsheet
Want to have an implementation in Excel? Download the Excel file: Zephyr Pain Index Excel