Tax drag
Tax drag (TD) captures the impact of taxes on performance. It is typically calculated using the future value of an investment after-tax. Tax drag can be expressed both as a percentage of the total pre-tax gain or as a dollar amount.
On this page, we discuss how to calculate the future value of an investment after-tax and the TD. We also implement both formulas using a numerical example. The Excel spreadsheet can be downloaded at the bottom of the page.
Accrual taxes
Let’s take a simple kind of tax to illustrate the concept of tax drag. Accrual taxes are a periodic tax at a single tax rate on income or return. Most countries apply accrual taxation to dividends and interest. The future value of an investment after-tax under accrual taxation is:
![]()
where r(1-ti) is the after-tax rate of return. Thus, the FVIF is simply the after-tax value of a single initial currency unit invested. The ultimate effect of taxes on future value may still be hard to grasp. One way to measure the effect is by calculating the tax drag.
Tax drag definition
The drag can be computed as both an amount and as a percentage
![]()
![]()
![]()
![]()
where TD stands for tax drag.
Example
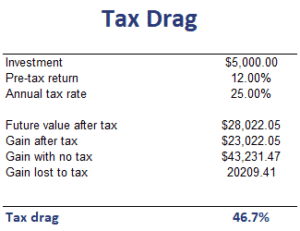
Let’s have a look at a numerical example to illustrate the calculation. The following table implements an example where we first calculate the ending after-tax value and then calculate the drag on performance resulting from taxes.
The spreadsheet we used can be downloaded at the bottom of the page.
Summary
We discussed the after-tax value under accrual accounting as well as the associated tax drag. Investors subject to taxes should be concerned with taxes, which may have a material impact on their net performance.
Download the Excel spreadsheet
Want to have an implementation in Excel? Download the Excel file: Tax drag calculator

