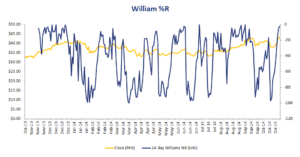
Williams %R
The Williams %R indicator is a technical indicator that relates the current closing price to the high and the low price over the past T trading days. The %R indicator was developed by Larry Williams. This metric can help investors to determine whether a stock or not a stock is overbought or oversold.
In what follows, we discuss the %R definition, look at an example in Excel, and finally discuss an example of how it can be used in combination with buy and sell signals.
Williams %R formula
Let’s start by discussing the Williams %R formula
The Williams indicator range is from -100 up to 0. A value of zero indicates that today’s close was the lowest over the past N days. A value of -100 indicates that today’s close was the highest over the past N days.
Williams %R technical analysis example
Larry Williams suggested a particular trading strategy that should be used in combination with his proposed measure. In particular, he suggested using N = 10 days and considered values below -80 as oversold. Values above -20 were considered to be overbought.
The strategy of Williams is not to trade these signals directly. Instead, buying should be done when:
- %R equals -100
- Five trading days passed since -100 was reached
- %R falls below -95 or -85
Selling a positions should occur when:
- %R equals 0
- Five trading days passed since 0 was reached
- %R rises above -5 or -15
Williams %R example
Let’s have a look at an example using actual stock data. The following Williams %R Excel table illustrates how to implement the formula. The spreadsheet can be downloaded at the bottom of the page.
As can be seen from the example, all we need to implement the %R is historical closing prices for the stock we wish to analyse.
Summary
We discussed the Williams percentage R, a technical indicator that is used to determine whether a position is overbought or oversold. This indicator is widely used by traders and fund managers to determine whether or not a stock is temporarily overbough or oversold.
%R calculator
Want to have an implementation in Excel? Download the Excel file: Williams %R calculator

