
Sloan Accruals Ratio
The Sloan accruals ratio, sometimes simply referred to as the Sloan ratio, is a measure of the quality of earnings that a company is reporting. The Sloan ratio was developed by Richard Sloan, a Professor of Accounting at the University of Michigan in a paper from 1996 titled “Do Stock Prices Fully Reflect Information in Accruals and Cash Flows about Future Earnings?”
On this page, we discuss the Sloan ratio formula, implement a numerical example and include an Excel spreadsheet that calculates the Sloan ratio. The Excel spreadsheet is available for download below.
Sloan ratio formula
The Sloan ratio is calculated by dividing the sum of a company’s discretionary accruals (the difference between net income and cash flow from operations) by the company’s total assets.
The formula is the following:

where:
- D(CA) is the change in current assets
- D(Cash) is the change in cash/cash equivalents
- D(CL) is the change in current liabilities
- D(STD) is the change in debt included in current liabilities
- D(TP) is the change in income taxes payable
- Dep is depreciation and amortization expense
where D() stands for the annual change. Accruals are then scaled by total assets. Alternatively, it is also possible to calculate the sloan ratio as follows:
Sloan ratio = (Net income – CFO – CFI) / total assets
where:
- CFO is cash flow from operations
- CFI is cash flow from investing operations
Sloan ratio interpretation
The Sloan ratio is used to identify companies that may be using accounting practices to manipulate their earnings, for example by delaying or accelerating the recognition of expenses or revenues from previous or future fiscal years.
A high Sloan ratio may indicate that a company is using such practices, which can potentially be a red flag for investors. Typically, a Sloan ratio higher than 10% is suspect.
Sloan accruals ratio example
Let’s turn to an example of the Sloan ratio. The following table implements the Sloan ratio using some concrete figures:
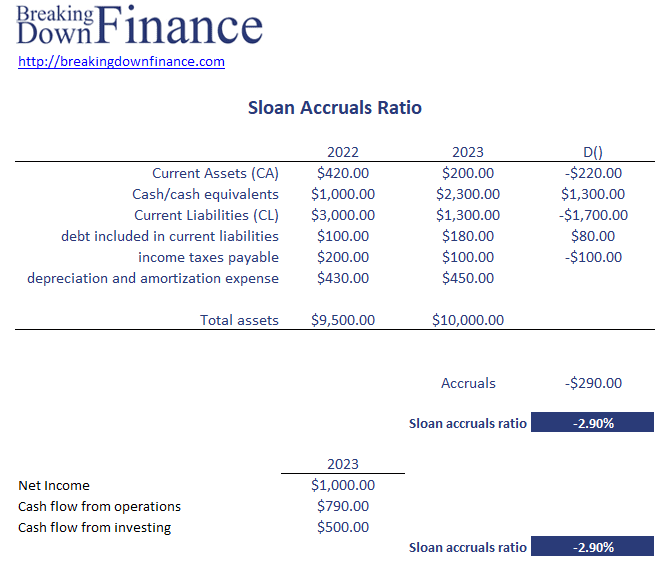
In this example, the company has a Sloan accruals ratio of 2%. This means that the difference between the company’s net income and its cash flow from operations is 2% of its total assets.
Caveats to the Sloan ratio
There is one important caveat to using the Sloan ratio. Recent research by Green, Hand and Soliman in 2011 in the paper “Going, Going, Gone? The Apparent Demise of the Accruals Anomaly” suggests that the Sloan ratio no longer predicts future stock returns. Thus, investors may have incorporated the insights to distinguish between bad and good companies
Summary
We discussed the Sloan ratio, a popular metric to assess the earnings quality of a company.
Download the Excel spreadsheet
Want to have an implementation in Excel? Download the Excel file: Sloan Accruals Ratio Excel