
Log-linear Trend Model
A log-linear trend model is a statistical model used in econometrics to describe the relationship between a dependent variable and one or more independent variables. In the case of a log-linear (LL) trend model, the dependent variable is assumed to follow a log-linear trend over time. This means that the percentage change in the dependent variable is constant over time.
These kinds of trend models are often used in economics and finance to analyze trends in data such as GDP, inflation, or stock prices. These kinds of models are particularly useful when the data we want to model exhibits exponential growth or decay over time. Trend models can capture such growth over time particularly well.
To estimate a LL trend model, researchers typically use statistical software to fit a linear regression model to the data, with the dependent variable transformed using the natural logarithm. The resulting model can be used to make predictions about the future trend of the dependent variable, and to evaluate the impact of changes in the independent variables on the dependent variable.
Log-linear trend model formula
The formula for a log-linear trend model is:

where:
- Y is the dependent variable
- a is the intercept term
- b is the slope term, which represents the percentage change in Y per unit change in t
- t is the independent variable (e.g., time)
- e is the error term, which represents the deviation of the dependent variable from the fitted model
Log-linear trend model example
To estimate a trend model, analysts will typically use statistical software to fit a linear regression model to the data, with the dependent variable transformed using the natural logarithm. The resulting model can be used to make predictions about the future trend of the dependent variable. The fitted model can also be used to evaluate the impact of changes in the independent variable on the dependent variable.
For example, if Y represents GDP and t represents time, the trend model can be used to estimate the percentage change in GDP over time and to evaluate the impact of changes in other variables (such as interest rates or government spending) on GDP.
The following table implements a simple example of a trend model in Excel.
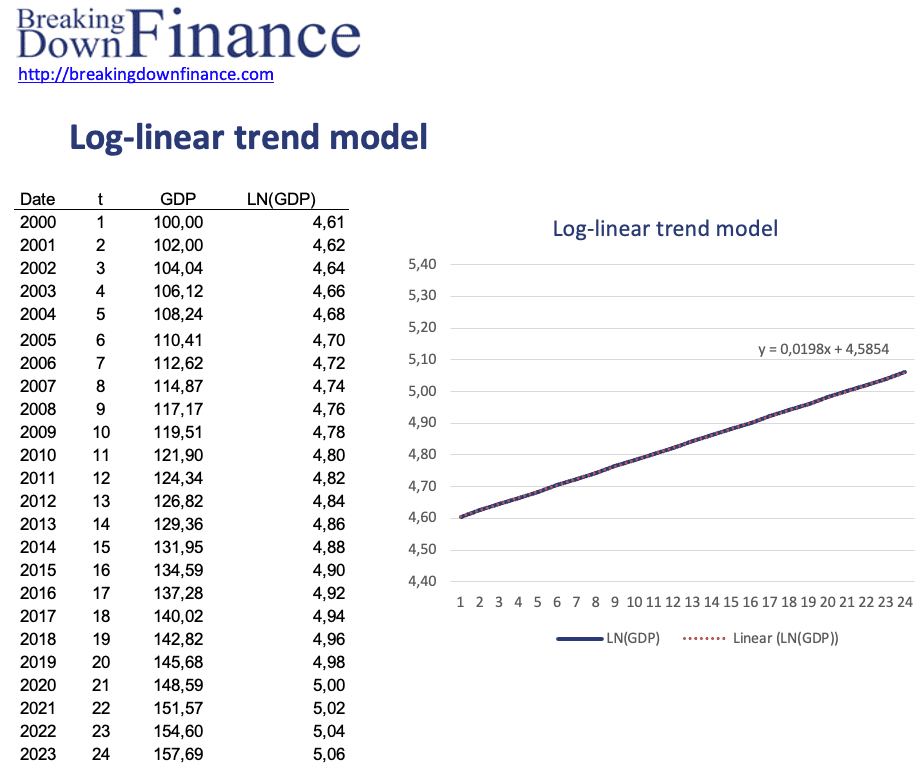
The spreadsheet can be found at the bottom of the page.
Summary
We discussed the log-linear trend model and how it can be used to predict variables that grow exponentially. We also illustrated how to implement the approach using Excel.
Download the Excel spreadsheet
Want to have an implementation in Excel? Download the Excel file: trend model in Excel