Square Root of Time Rule
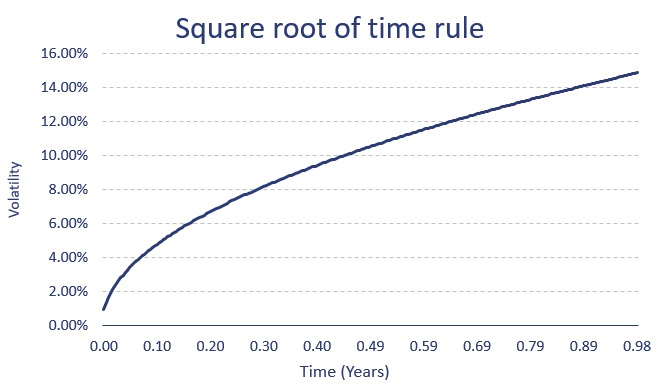
The square root of time rule is a simple heuristic used in finance to scale the volatility of financial assets or portfolios from one frequency to another. Volatility scaling refers to the process of adjusting a volatility estimate for a financial asset or a portfolio to another time horizon.
Investors often use the square root rule to adjust value-at-risk estimates or volatility estimates. Note that the rule is only valid if the returns are iid and follow a normal distribution.
The square root of time rule suggests that the volatility of a financial asset or portfolio should be scaled by the square root of the length of the investment horizon. The length could be days, months or years.
On this page, we explain the square root of time rule. In addition, we provide an Excel spreadsheet that allows you to easily convert from one frequency to another. The Excel spreadsheet is available for download at the bottom of the page.
Square root of time rule formula
The appropriate formula for scaling the volatility of a financial asset or portfolio using the square root rule is:
Volatility Scaled = Volatility * sqrt(Investment Horizon)
Here, “Volatility” is the annualized volatility of the asset or portfolio, and “Investment Horizon” is the length of the investment period in years. While the formula above applies to years, the formula can be used to go from any frequency to another frequency.
Square root of time rule example
Let’s consider an example with annual data first. For example, if the volatility of a stock is 20% per year and an investor wants to invest for a two-year period, the square root rule would suggest that the investor should scale the volatility of the stock to 20% * sqrt(2) = 28%.
This means that the investor should expect the stock’s price to fluctuate by an average of 28% over the two-year investment horizon.
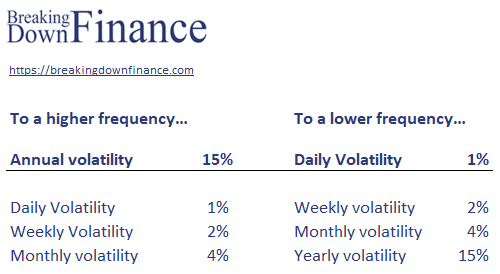
We can use Excel to easily implement the above approach. We can also generalize the volatility scaling rule to any time frame. We can convert monthly to annual, annual to weekly volatility, etc.
The spreadsheet below illustrates how to use the rule to move from daily or monthly volatility to an annualized volatility estimate.
Summary
We briefly explain a simple heuristic to scale the volatility of an instrument or portfolio from one frequency to another.
Download the Excel spreadsheet
Want to have an implementation in Excel? Download the Excel file: Volatility scaling – Excel Example


