Trade Cost Analysis
Trade cost analysis (TCA) is used to evaluate trade execution. TCA is vital for portfolio managers to be able to assess the effectiveness of brokers, algorithms, and other strategies.
Costs are evaluated versus specified price benchmarks, which vary depending upon the objectives of the manager or nature of the order. This benchmark price could be an arrival price, VWAP, TWAP, or the closing market price.
On this page, we discuss the most commonly used TCA formula and illustrate its application using a numerical example. The spreadsheet can be downloaded at the bottom of the page.
Trade cost analysis formula
In general, buyers incur costs if they execute trades above relevant benchmark prices, while sellers incur costs if they execute below relevant benchmark prices. Trade costs are calculated such that a positive value represents underperformance against the benchmark, and can generally be formulated as follows:
These costs are typically expressed in basis point of the original benchmark price, using the following expression:
Trade cost analysis example
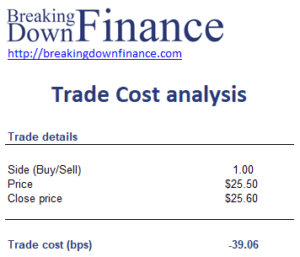
Let’s imagine a portfolio manager is executing a buy order using a market on close (MOC) benchmark. The manager purchases at $25.50, and the closing price of the stock is $25.60. Let’s calculate the cost (in basis points) based on the closing price benchmark:
The spreadsheet that implements this example is available for download at the bottom of the page.
Summary
We have discussed the basic approach used when performing ex-post trade cost analysis. Sometimes, a market-adjusted cost of the trade is used.
Download the Excel spreadsheet
Want to have an implementation in Excel? Download the Excel file: TCA example

