
Rolling Sharpe Ratio
Calculating a rolling Sharpe ratio (SR) is a very useful way to analyze the historical performance of an investment or fund. This is because a rolling SR gives investors insights on the time-varying performance of a strategy. On this page, we briefly discuss the Sharpe ratio, discuss the advantage of using a rolling Sharpe ratio and finally include an Excel example that shows you how to calculate the rolling SR.
Sharpe ratio
Before we discuss the rolling Sharpe ratio, let’s first discuss the regular Sharpe ratio (SR). The following formula will yield the Sharpe ratio:

Thus, the Sharpe ratio is the excess return (i.e. the return over the risk-free rate) per unit of risk taken.
Rolling Sharpe ratio definition
Using the above definition of the Sharpe ratio, we can easily calculate the rolling SR. A rolling SR is, as the name suggests, a Sharpe ratio that is calculated in a rolling way over a certain period. The latter is called the lookback period or fixed time window.
Thus, we apply the above formula to a fixed time window which we then repeat every day, moving the fixed time window. When calculating a rolling measure, the choice of the window is the hardest part. Very often, 60 days is used in the case of daily data, and 36-months is used in the case of monthly data.
Advantages
What are the advantages of calculating a rolling SR? There are several advantages. First, calculating the Sharpe ratio in this way tells you a lot about the time-varying performance of the strategy. In particular, it tells you whether the strategy tends to underperform from time to time, or whether it has performed well consistently. Second, and related to the first point, a rolling SR allows investors to identify when the strategy tends to underperform. Does the strategy perform badly during market selloffs, or during rallies? This can help answer the question of whether the strategy is a good hedge against crises.
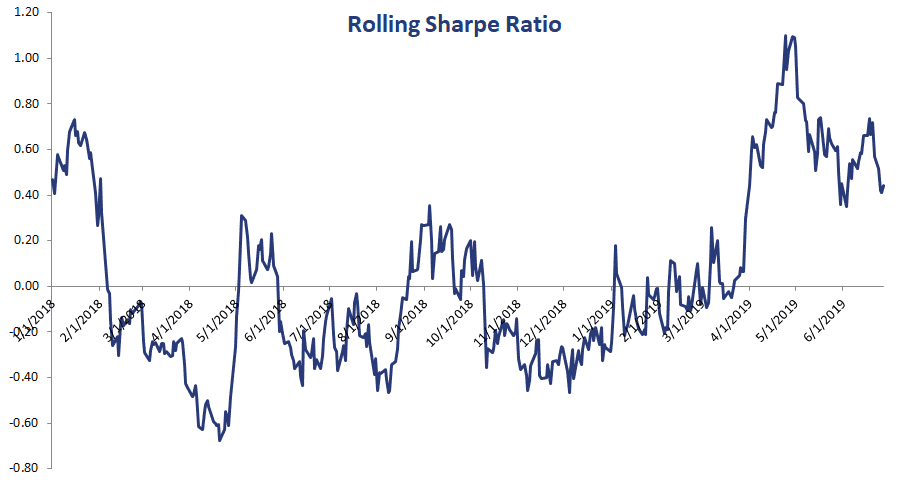
Rolling Sharpe ratio example
Finally, let’s look at an implementation of the rolling SR using daily data. The following figure shows what the rolling SR looks like. The spreadsheet can be downloaded below.
Summary
We discussed how we can use the Sharpe ratio in a rolling fashion to investigate an investment’s time-varying performance. The rolling SR is commonly used by investors that wish to invest in hedge funds. It is probably the most widely used rolling performance measure used by investors.
Rolling Sharpe calculator
Want to have an implementation in Excel? Download the Excel file: Rolling Sharpe Ratio Excel