
Roy’s safety first criterion
Roy’s safety first criterion is one of the first metrics that measures the amount of downside or tail risk. It is a risk management technique that helps investors to choose among different portfolios. It was introduced by Arthur Roy in 1952.
On this page, we discuss Roys SF metric and provide a numerical example that illustrates how it can be used to compare portfolios. We also compare Roy’s SF with the Sharpe ratio. At the bottom of the page, we include an Excel file that helps you to implement the SFRatio.
Definition Roy’s safety first
Roy introduced the SFRatio in 1952 in Econometrica. It is an example of a safety-first rule. This means that, as an investor, we care mostly about the likelihood that the portfolio will return less than expected. An important assumption we make when using Roy’s SF criterion is that returns are normally distrituted. While this is clearly not the case in practice, it is nevertheless a good first approximation when analyzing a portfolio.
Suppose we say that we don’t want the portfolio return RP to fall below the threshold return, RL. In that case, the optimal portfolio is the portfolio that maximizes the SFR ratio:

Shortfall probability
To calculate the probability that the portfolio will fall below the threshold return, we can use the standard normal distribution. In particular, the probability that the portfolio generate a return lower than the threshold return equals:

As we can see, Roy’s safety first criterion is a nice application of the normal distribution in solving practical finance problems.
Roy or Sharpe
As some may have noticed, the way we define SF is very similar to the definition of the Sharpe ratio. In fact, the Sharpe ratio is actually Roy’s safety first criterion using the risk-free rate as the threshold return RL. As such, the Sharpe ratio is the portfolio that minimizes the likelihood that the portfolio will return less than the risk-free rate.
Roy’s safety first example
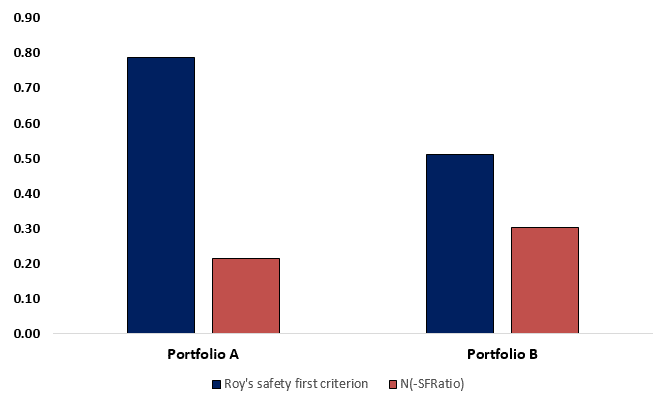
Now, lets illustate how we can use the SFRatio the choose among two portfolios the portfolio that has the lowest probability of generating the threshold return. Let’s assume we have two portfolios; portfolio A has an expected return of 25% and a standard deviation of 27%, portfolio B has an expected return of 14% and a standard deviation of 20%. Let’s assume that we want to generate a return of at least 3.75%.
Let’s calculate the SFRatios:


Clearly, portfolio A has a higher SFRatio. Next, we can also calculate the probability of the portfolios generating less than the threshold return of 3.75%.


This means that the probability that Portfolio A will generate a return less than the threshold of 3.75% is 21.6%.
Summary
We discussed Roy’s safety first criterion. A downside risk measure that can be used to choose among portfolios to choose the porfolio that has the lowest probability of falling below a threshold return. At the bottom, we provide a Roy’s Safety first example Excel template.
SFRatio example Excel
Want to calculate it yourself? Download our Excel file: Roy’s safety first criterion