Upside Potential Ratio (UPR)
The Upside-Potential-Ratio (UPR) was introduced by Sortino and co-authors in 1999. The ratio is motivated from findings in the area of behavioural finance. In particular, behavioral finance researchers observed that investors seek upside potential and downside protection. That is, investors are risk-seeking above a certain threshold return, but risk-averse below this threshold.
This implies that people worry more about downside risk, and thus prefer investments that have lower downside risk. On this page, we discuss the upside potential ratio definition, explain the formula, and finish with an simple example implemented in Excel.
Upside-potential ratio definition
The upside-potential ratio tries to measure the attractiveness of a security’s returns by giving a higher weight to negative deviations below the threshold return. This threshold return can be a certain required return (e.g. the risk free rate). Alternatively, we can choose a threshold return equal to zero. The threshold is also used to calculate the nominator. In particular, the numerator is equal to the average return of returns above the same threshold.
Upside-potential ratio formula
The ratio can be calculated as follows
Where HPM1 is the first higher partial moment, and LPM2 is the second lower partial moment. Thus, to calculate the upside potential ratio, we should calculate two partial moments. To calculate lower partial moments, more information and an Excel spreadsheet is available here.
The way the UPR works is that, by weighting the negative deviations more heavily, the denominator of the upside-potential ratio increases. For a given HPM1 the upside-potential ratio decreases. Thus, an investor will require a higher return to choose an investment, when comparing it to a similar investment with less downside.
Example
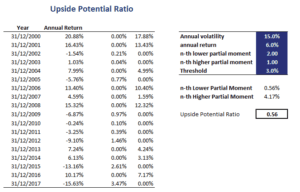
Let’s continue with an example. Suppose we have a series of returns. The first step is to calculate the necessary partial moments. Once we have the first higher partial moment and the second lower partial moment, we can calculate the UPR.
The above example was calculated using a spreadsheet. The upside potential ratio Excel spreadsheet is available at the bottom of this page.
Summary
We discussed the upside-potential ratio, an alternative to the Sharpe ratio. This ratio differs from the Sharpe ratio in that the UPR only looks at volatility (and expected returns) above (below) a certain level.
Upside Potential Ratio Calculator
Want to calculate the upside potential ratio? Download the Excel file available here: Upside Potential Ratio template

