
H-Model
The H-model is a two-stage dividend discount model that assumes the growth rate is initially high but declines linearly over a specific period. It can be used when we expect the growth rate of earning to decrease over time as competitors enter the market. The model is a variation to the standard dividend growth model proposed by Myron J. Gordon. The model can be used to model a linearly declining growth rate.
On this page, we discuss the H-model in more detail, provide the H-model formula and finally implement the H-model using an Excel spreadsheet. The dividend growth model calculator is available at the bottom of the page.
H-Model definition
In most cases, the long-term growth rate does not drop abruptly from the high growth rate to a low growth rate. Instead, we can easily imagine cases where the growth rate slowly declines to the long-term growth rate. Such behavior can easily be modelled using the H-model.
Before we continue, there is one important aspect we need to stress. The H-model is an approximation. That means that the result will not be exactly equal to the value if we model each of the cash flows separately. The approximation will be more accurate
- the shorter the high-growth period
- the smaller the spread between the short-term and the long-term growth rate
The H in the H-model refers to a particular parameter that we have to calculate. In particular, H is the half-life of the model. This parameter captures the speed at which the growth rate converts to the long-term growth rate. It is calculated as follows

where t is the length of the high growth period.
H-model formula
Once we have the H, the full H-model formula looks as follows:

where D0 is the current dividend, gS is the short-term growth rate, gL is the long-term growth rate, and r is the required rate of return.
H-model interpretation
The first term is what the shares would be would be worth if there was only a low growth period. The second term is an approximation of the value that results from the linearly declining high-growth phase.
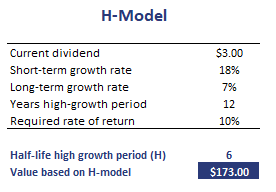
H model example
Finally, let’s put the formulas to work. The following table implements the above formulae to calculate the fundamental value of a growth company. The spreadsheet can be downloaded using the link reported below.
Summary
We discussed the H-model, a simple formula to approximate the value of a company for which we expect the high growth rate to decline linearly to a lower long-term growth rate.
H-model calculator Excel
Want to have an implementation in Excel? Download the Excel file: H-model implementation