
Baumol-Tobin Model
The Baumol-Tobin model of money demand is a model that describes economic agents’ demand for money for transactions. The model was first developed by William Baumol in 1952. In 1956, however, James Tobin developed the same model independently from William Baumol. The theory argues that people tradeoff having money for liquidity considerations and forgoing interest on that money. The model is also used in corporate finance by companies to manage the amount of cash the company should hold.
On this page, we discuss the assumptions that underlie the Baumol-Tobin for cash management, discuss the formulas and illustrate the approach using a numerical example. The Excel spreadsheet used to calculate the example is available for download at the bottom of the page.
Baumol-Tobin Model assumptions
The following set of assumptions apply in case one uses Baumol’s inventory theoretic approach:
- The minimum cash balance is zero (no borrowing)
- The interest rate is constant (opportunity cost from holding cash)
- Money can only be held or invested in short-term money market securities
- Total cash requirements are known and cash is spent at a constant rate
- Transaction cost is fixed
Under these assumptions, we can derive the Baumol inventory model.
Baumol-Tobin model formula
First, we have the total cost (TC) equation

where K is the interest rate on marketable securities (opportunity cost of cash), T is the total cash need (on an annual basis), F is the transaction cost (for buying or selling marketable securities), and C is the cash balance.
To find the minimum, that is, the cash balance with the lowest overall cost, we have to calculate the first derivative of the above total cost function with respect to C and set it equal to zero


This level of C is the optimal cash balance (OCB).
Baumol-Tobin Model Example
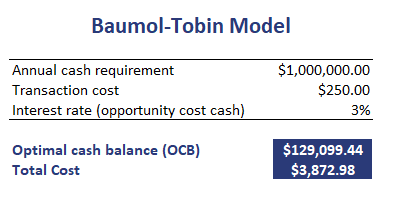
Let’s have a look at a numerical Excel example. Suppose we have a company ABC that requires $1,000,000 in cash each year and spends the cash at a constant rate. Money market instruments yield 3% per year and the transaction cost is $250 per transaction. The following table calculates the OCB.
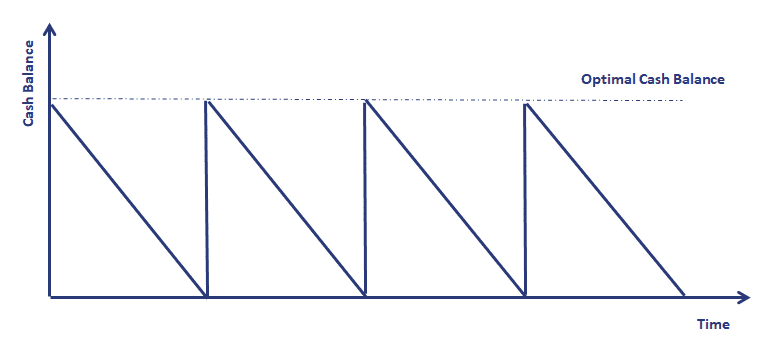
The following figure illustrates what the cash balance looks like. Clearly, the company will perform a cash balance replenishment when cash reaches zero to bring it back to the OCB.
Summary
We discussed the Baumol-Tobin model, which is used in corporate finance for cash management
Download the Excel spreadsheet
Want to have an implementation in Excel? Download the Excel file: Baumol-Tobin Model template