
Coskewness
Coskewness and cokurtosis are statistical metrics that are used in finance to analyse how securities comove. While skewness and kurtosis are based on data on a single variable, coskewness and cokurtosis analyse the relationship between two variables. That’s why these measures are referred to as higher order cross moments or multivariate higher moments.
On this page, we discuss the coskewness definition and formula as well as the cokurtosis definition and formula. We also calculate both metrics using a numerical example. A coskewness Excel calculator is available at the bottom of the page.
Coskewness formula
Let’s start with the definition of coskewness. Coskewness measures the extent to which two variables undergo extreme deviations at the same time. Thus, a positive value suggests that both variables exhibit high positive values at the same time, whereas a negative value means that both variables tend to have highly negative values at the same time.
Applying this concept to finance and stock market investing, it means that a stock with a high negative coskewness will go down a lot in periods when the stock market goes down a lot and vice-versa.
The coskewness formula looks as follows
![$$S(X,Y,Z)={\frac {\operatorname {E} \left[(X-\operatorname {E} [X])(Y-\operatorname {E} [Y])(Z-\operatorname {E} [Z])\right]}{\sigma _{X}\sigma _{Y}\sigma _{Z}}}}$$](https://breakingdownfinance.com/wp-content/ql-cache/quicklatex.com-46c56390e451e845b5f5d680d1b337b8_l3.png "Rendered by QuickLaTeX.com")
Don’t worry on how to implement the formula in Excel. We will deal with that later.
Cokurtosis formula
Cokurtosis is interpreted in a similar fashion. It measures the extent to which variables undergo extreme positive and negative deviations at the same time. Thus, a security with a high cokurtosis with the market will have fat-tailed returns when the market has fat-tailed returns, and vice versa.
The formula for cokurtosis looks as follows
![$$ K(X,X,Y,Y) = {\operatorname {E} {{\big [}(X-\operatorname {E} [X])^{2}(Y-\operatorname {E} [Y])^{2}{\big ]}} \over \sigma _{X}^{2}\sigma _{Y}^{2}}}$$](https://breakingdownfinance.com/wp-content/ql-cache/quicklatex.com-7a8436393e6981ec3249cbd23075ff6c_l3.png "Rendered by QuickLaTeX.com")
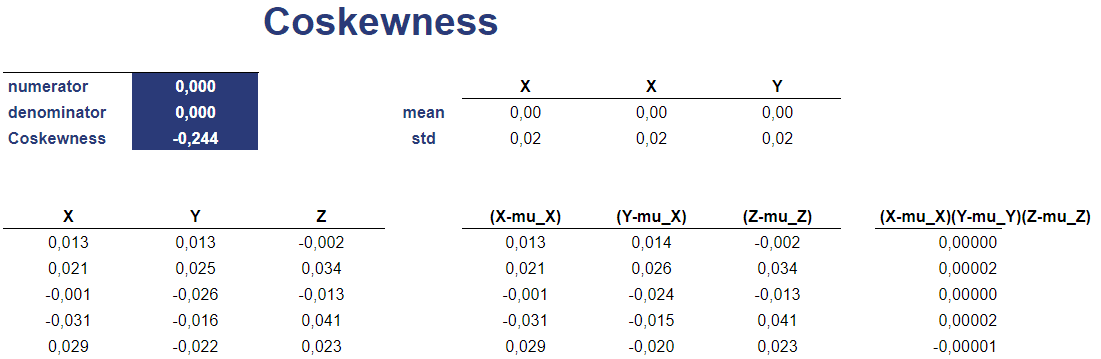
Coskewness example
Let’s consider a numerical example that illustrates how to calculate coskewness. The table illustrates the necessary steps. The Excel spreadsheet is available below.
Cokurtosis example
Now, we use the same data to calculate the cokurtosis. The table below shows the necessary steps

Summary
We discussed coskewness and cokurtosis. both measures are useful to understand how variables comove. That is, when a stock index posts strong negative returns, are the returns of the asset also strongly negative or not? This is very useful in the context of risk management and is not captured by the univariate counterparts (skewness and kurtosis).
Download the Excel spreadsheet
Want to have an implementation in Excel? Download the Excel file: Coskewness Excel spreadsheet