
Information ratio
The information ratio (IR), sometimes also called the appraisal ratio, is one of the most important ratios used in active management and finance. The ratio is very similar to the Sharpe ratio (SR), and both are often mixed up. On this page, we discuss the information ratio definition, we give some numerical examples, and finally we provide an Excel file at the bottom of the page that illustrates how to calculate the information ratio in Excel.
Information ratio definition
As we already discussed in the introduction, the information ratio in finance is one of the most important ratios in active management. The appraisal ratio measures the level of outperformance of an active strategy over the benchmark.

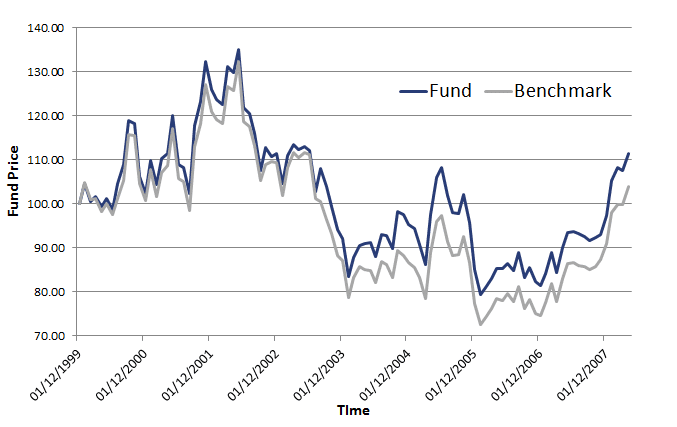
Where rs is the strategy return and rb is the benchmark return. The difference between both is the active return. As such, the IR is equal to the expected active return divided by the tracking error. In other words, the ratio measures the active return of the investor’s strategy divided by the amount of risk that the he or she takes relative to the benchmark. Looking at the formula, it is obvious that a negative information ratio is clearly possible. In that case, the manager is underperforming the benchmark. A positive information ratio, as is the case in the following figure, means that the manager is outperforming the benchmark.
Information ratio example
Using the above definition, we can calculate the IR for any strategy, as long as we have a sufficiently long history of daily or monthly returns for both the strategy and the benchmark portfolio.
Suppose we have a strategy that earned an average of 5% p.a. Over the same year, the average return of the benchmark was only 3%. Furthermore, the volatility of this difference was 5% annualized. In that case, the IR equals

or 0.4. This is actually a fairly high IR, as we will discuss later. In the Excel file at the bottom of this page, we illustrate the above calculation in more detail.
Information ratio vs Sharpe ratio
How does the IR differ from the Sharpe ratio (SR)? First, let’s look at the definition for the Sharpe ratio

Clearly, the difference between the IR and SR is related to the benchmark return. Whereas the benchmark in the case of Sharpe ratio is the risk-free rate rf, in the case of the IR it is the relevant expected benchmark return to which the manager is benchmarked. In other words, if we would take the risk-free rate as the benchmark, then both ratios would be equivalent.
What is a good information ratio?
Clearly, the higher the IR the better. If the IR is negative, then the manager did not succeed in beating the benchmark. Outperforming the benchmark is not an easy task, of course. Typically, an IR between 0.4 to 0.6 is quite good.
Information ratio Excel
Finally, we implement the calculation of the information ratio in Excel. In particular, we show how to determine the benchmark return, the portfolio return, and the volatility of the difference between both (which is sometimes called the tracking error). We then annualize the return and the standard deviation and calculate the IR.
Calculation
Want to have an implementation in Excel? Download the Excel file: information ratio calculation.