
Stutzer Index
The Stutzer performance index is a portfolio performance index proposed by Michael Stutzer, a professor of finance at the University of Iowa, in 2000. Stutzer proposed the measure in an article in the Financial Analysts Journal (FAJ) titled ‘A Portfolio Performance Index’. The index assumes that investors want to minimize the probability of investing in a fund that exhibits underperformance relative to its benchmarks.
We discuss the Stutzer performance index formula and explain how to implement the performance index in Excel. A numerical example of the performance index can be found at the bottom of the page.
Stutzer Index Formula
Mathematically, the Stutzer measure captures the fact that investors will seek funds where the probability of negative active returns decays to zero over the long term. The performance index is therefore the probability (of negative active returns) decay rate and can be calculated as follows:
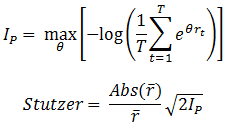
where rt are the excess returns, IP is the information statistic, θ is the value that maximizes IP, r-bar is the average excess return.
The higher the index, the better. What’s interesting about this measure is that it penalizes negative skew (high negative returns) and high kurtosis (fat tails). In addition, the result is the same as the Sharpe ratio in the case the returns are normally distributed. The drawbacks of the measure are the fact that it requires a lot of data to accurately calculate the index. While the formula may be a bit daunting, it is easy to implement it using spreadsheet software such as Excel.
Applications
There are several important applications of the performance index. First, the index is calculated by Morningstar for each fund over the past three years. Second, the index is intensively used to benchmark hedge funds. The reason the measure is particularly attractive in the context of alternative investments is the fact the Stutzer performance index does not assume that returns are normally distributed.
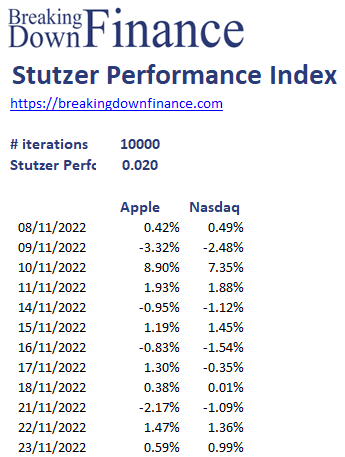
Stutzer Performance Index example
Let’s consider a numerical example to illustrate the calculation of the Stutzer index. The following table applies the above formulas using Excel. The spreadsheet is available for download at the bottom of this page.
Summary
We discussed the the Stutzer index, which indicates how well a fund has been able at transforming the risk into return.
Download the Excel spreadsheet
Want to have an implementation in Excel? Download the Excel file: Stutzer Performance Index