
Measures of Internal Dispersion
Internal dispersion is a measure of the range of returns of accounts included in a composite over a period of time. Portfolios added or removed should not be included when calculating the measure of internal dispersion. Global Investment Performance Standards (GIPS) requires firms to report at measures of internal dispersion for composites that contains six or more accounts.
On this page, we discuss and implement the different measures of internal dispersion. We also implement a numerical example. The spreadsheet can be downloaded at the bottom of the page.
Internal dispersion measures
The acceptable methods for calculating internal dispersion are the following:
- the range of annual returns
- the high and low annual returns
- the interquartile range
- the standard deviation of equally-weighted annual returns
- the asset-weighted standard deviation of annual returns
The range of annual returns and the high and low annual returns are the simplest and most easily understood measures of dispersion. The advantages of these measures include simplicity, ease of calculation, and ease of interpretation. Disadvantages include the fact that an extreme value can skew the data, and they do not stand alone as adequate risk measures.
The interquartile range is the middle 50% of a population, excluding the top 25% and the bottom. Hence, it measures the part of the population between the bottom of the first quartile and the bottom of the bottom of the third quartile.
The standard deviation across equally weighted portfolios is the most widely accepted measure of dispersion within a composite. The formula equals:
![$$ \sigma_C = \sqrt{\frac{\sum_{i=1}^{n}[R_i - \bar R]^2}{n-1}} $$](https://breakingdownfinance.com/wp-content/ql-cache/quicklatex.com-634a32899520d5f8890ed41e073dd07e_l3.png "Rendered by QuickLaTeX.com")
where Ri is the annual return on portfolio i, r-bar is the equal-weighted mean composite return and n is the number of portfolios.
The standard deviation with asset-weighted composite returns is calculated as follows:

where wi is the market weight of portfolio i relative to the market value of the composite and C is the composite’s asset-weighted return.
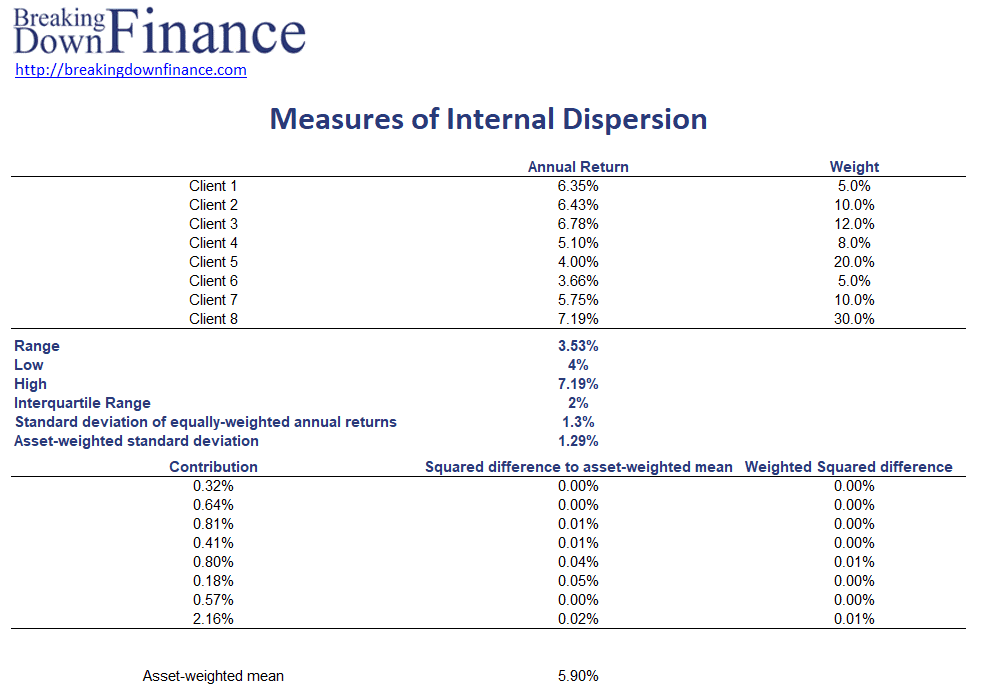
Dispersion measures example
The following table illustrates how to implement each of these measures using an Excel spreadsheet. The spreadsheet can be downloaded at the bottom of the page
Summary
We discussed several measures of dispersion that investors can use to understand the variability of returns of accounts included in a composite.
Download the Excel spreadsheet
Want to have an implementation in Excel? Download the Excel file: Measures of Internal Dispersion Example